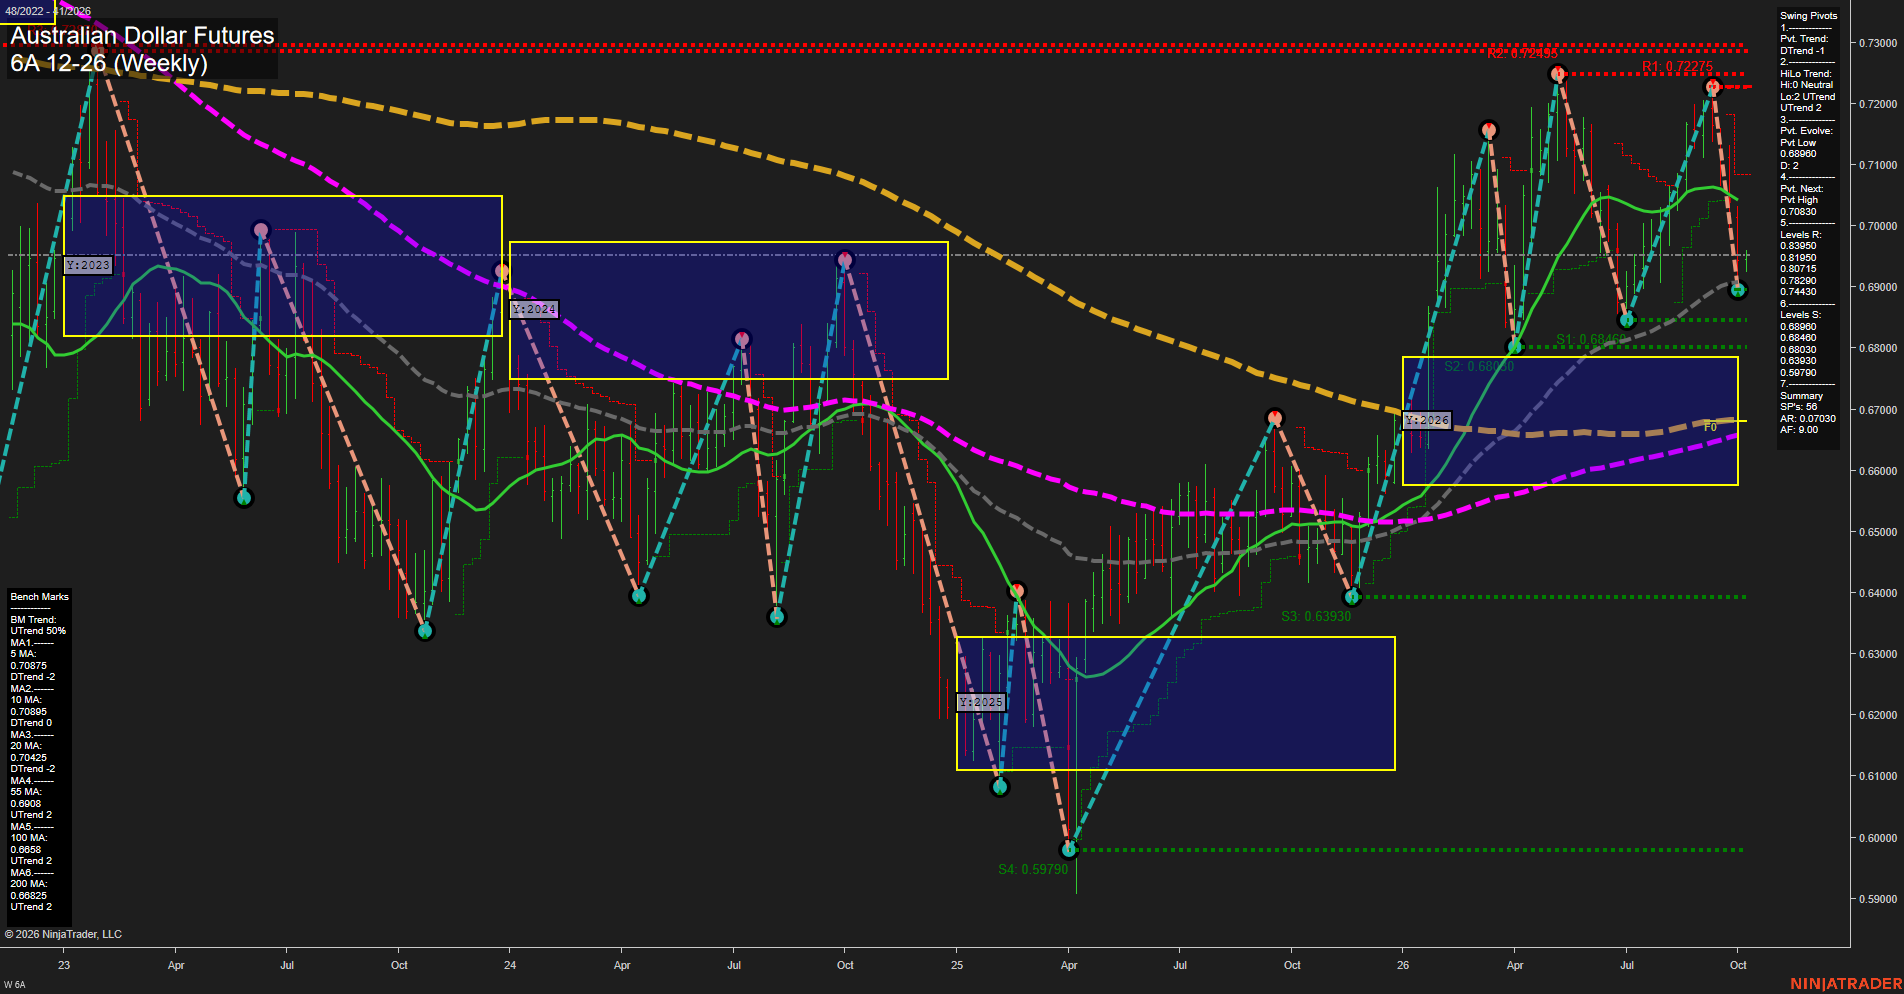
6A Australian Dollar Futures Weekly Chart Analysis: 2026-Oct-05 07:00 CT
Price Action
- Last: 0.68980,
- Bars: Large,
- Mom: fast.
WSFG Weekly
- Short-Term
- WSFG Current: 7%
- F0%/NTZ' Bias: Price Above,
- WSFG Trend: Up.
MSFG Month Oct
- Intermediate-Term
- MSFG Current: 2%
- F0%/NTZ' Bias: Price Above,
- MSFG Trend: Up.
YSFG Year 2026
- Long-Term
- YSFG Current: 26%
- F0%/NTZ' Bias: Price Above,
- YSFG Trend: Up.
Swing Pivots
- (Short-Term) 1. Pvt. Trend: DTrend,
- (Intermediate-Term) 2. HiLo Trend: UTrend,
- 3. Pvt. Evolve: Pvt low 0.68980,
- 4. Pvt. Next: Pvt high 0.70830,
- 5. Levels R: 0.83950, 0.81950, 0.80715, 0.78300, 0.74430,
- 6. Levels S: 0.68980, 0.68460, 0.68030, 0.63970, 0.59790.
Weekly Benchmarks
- (Short-Term) 5 Day: 0.70875 Down Trend,
- (Short-Term) 10 Day: 0.70895 Down Trend,
- (Intermediate-Term) 20 Day: 0.70425 Down Trend,
- (Intermediate-Term) 55 Day: 0.69080 Up Trend,
- (Long-Term) 100 Day: 0.66580 Up Trend,
- (Long-Term) 200 Day: 0.66825 Up Trend.
Recent Trade Signals
- 02 Oct 2026: Short 6A 12-26 @ 0.69115 Signals.USAR-MSFG
Overall Rating
- Short-Term: Bearish,
- Intermediate-Term: Bullish,
- Long-Term: Bullish.
Key Insights Summary
The weekly chart shows a sharp countertrend selloff from the 0.72275 pivot-high area into the active 0.68980 pivot-low zone. Short-term structure and the 5, 10, and 20-period benchmarks are bearish, reflecting fast downside momentum and a lower-high reversal pattern. The intermediate and long-term structure remains constructive because price is above the monthly and yearly F0% levels, while the 55, 100, and 200-period benchmarks retain upward trends. The 0.68460 and 0.68030 supports define the nearby downside structure, while 0.70830 is the next pivot reversal level and 0.74430 remains the major overhead resistance.
Chart Analysis ATS AI Generated: 2026-10-05 07:00 for Informational use only, not trading advice. Terms and Risk Disclosure Copyright © 2026. Algo Trading Systems LLC.