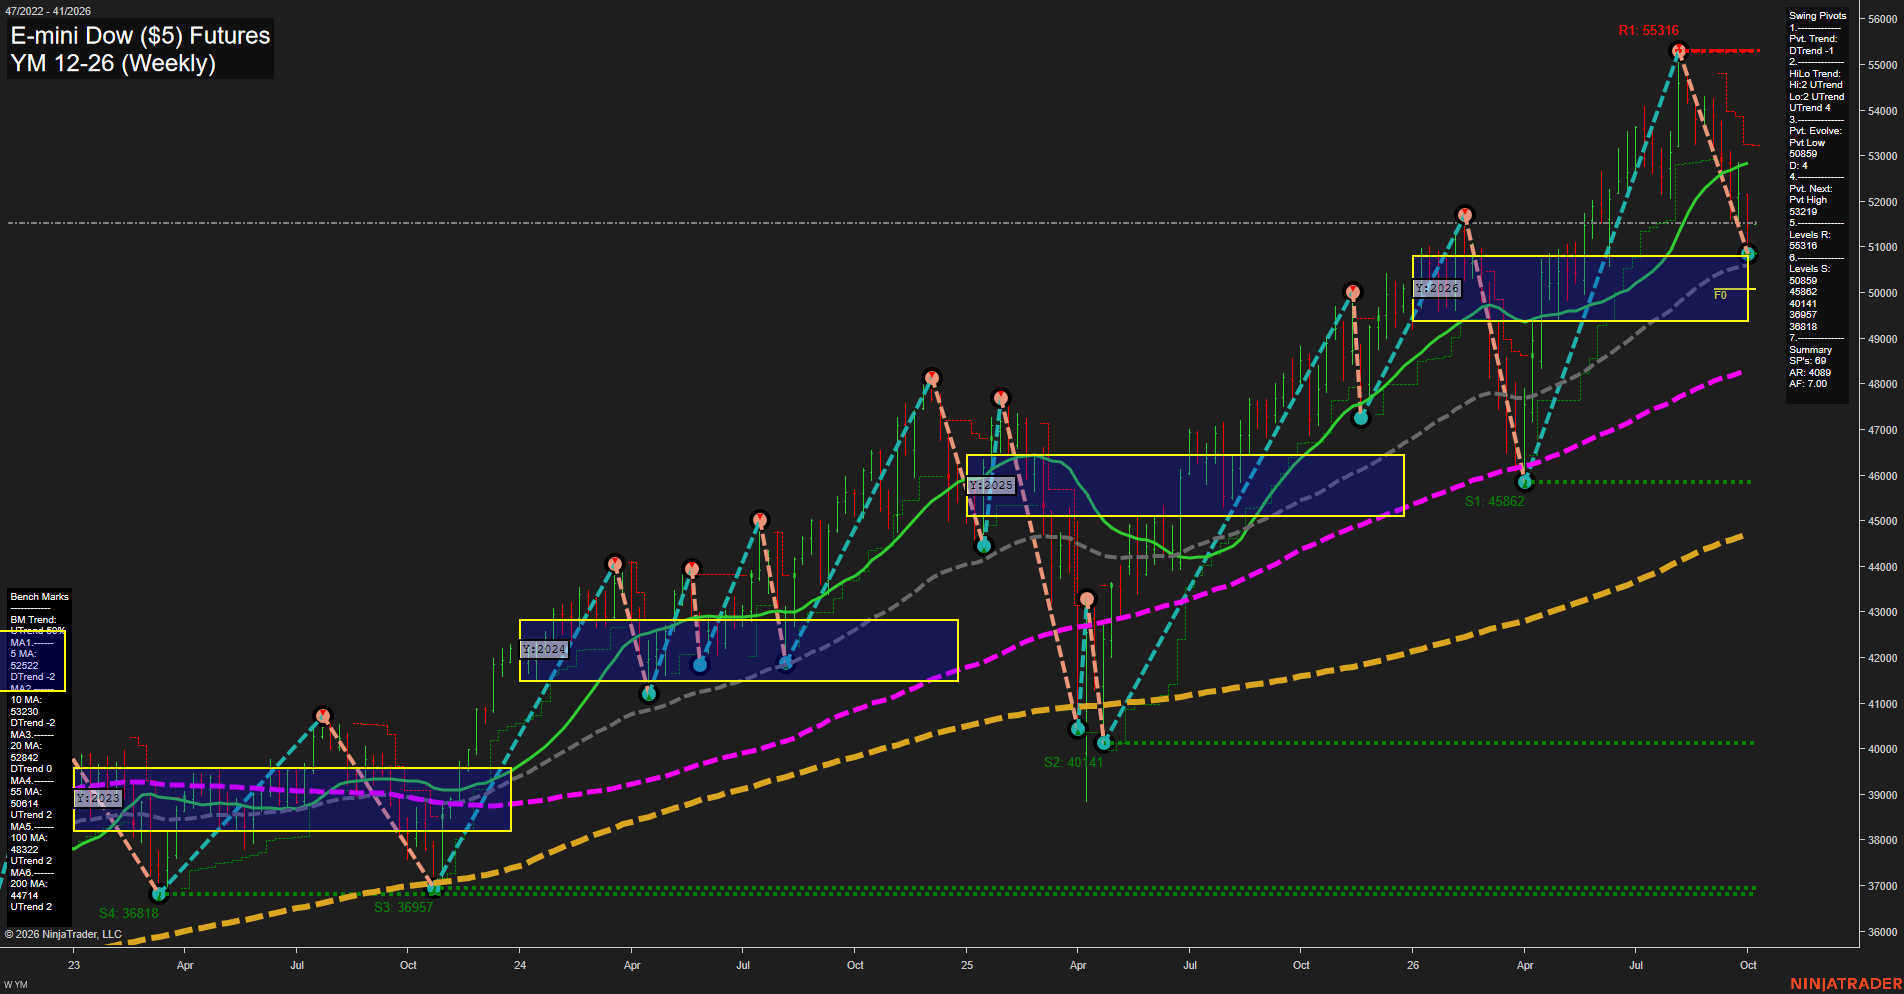
YM E-mini Dow ($5) Futures Weekly Chart Analysis: 2026-Oct-04 18:09 CT
Price Action
- Last: 50859,
- Bars: Large,
- Mom: fast.
WSFG Weekly
- Short-Term
- WSFG Current: -51%
- F0%/NTZ' Bias: Price Below,
- WSFG Trend: Down.
MSFG Month Oct
- Intermediate-Term
- MSFG Current: 7%
- F0%/NTZ' Bias: Price Above,
- MSFG Trend: Up.
YSFG Year 2026
- Long-Term
- YSFG Current: 20%
- F0%/NTZ' Bias: Price Above,
- YSFG Trend: Up.
Swing Pivots
- (Short-Term) 1. Pvt. Trend: DTrend,
- (Intermediate-Term) 2. HiLo Trend: UTrend,
- 3. Pvt. Evolve: Pvt low 50859,
- 4. Pvt. Next: Pvt high 53219,
- 5. Levels R: 55316,
- 6. Levels S: 50859, 45862, 40141, 36957, 36818.
Weekly Benchmarks
- (Short-Term) 5 Day: 52520 Down Trend,
- (Short-Term) 10 Day: 53230 Down Trend,
- (Intermediate-Term) 20 Day: 52843 Down Trend,
- (Intermediate-Term) 55 Day: 50514 Up Trend,
- (Long-Term) 100 Day: 48322 Up Trend,
- (Long-Term) 200 Day: 44718 Up Trend.
Recent Trade Signals
- 01 Oct 2026: Short YM 12-26 @ 51011 Signals.USAR-MSFG
- 29 Sep 2026: Short YM 12-26 @ 51498 Signals.USAR.TR120
- 29 Sep 2026: Short YM 12-26 @ 51865 Signals.USAR-WSFG
Overall Rating
- Short-Term: Bearish,
- Intermediate-Term: Bullish,
- Long-Term: Bullish.
Key Insights Summary
YM is in a fast, large-range weekly pullback from the 55316 pivot high, with price below the weekly Fib center and beneath the declining 5, 10, and 20 Day benchmarks. The active pivot structure is short-term bearish, while 50859 is the immediate pivot-low support and 53219 defines the reversal threshold for a new pivot high. The broader structure remains constructive: the intermediate HiLo trend, monthly and yearly Fib grids, and rising 55, 100, and 200 Day benchmarks retain an upward bias. This creates a counter-trend correction within the larger advance, with 45862 as the next major lower support and 55316 remaining the principal overhead resistance.
Chart Analysis ATS AI Generated: 2026-10-04 18:09 for Informational use only, not trading advice. Terms and Risk Disclosure Copyright © 2026. Algo Trading Systems LLC.