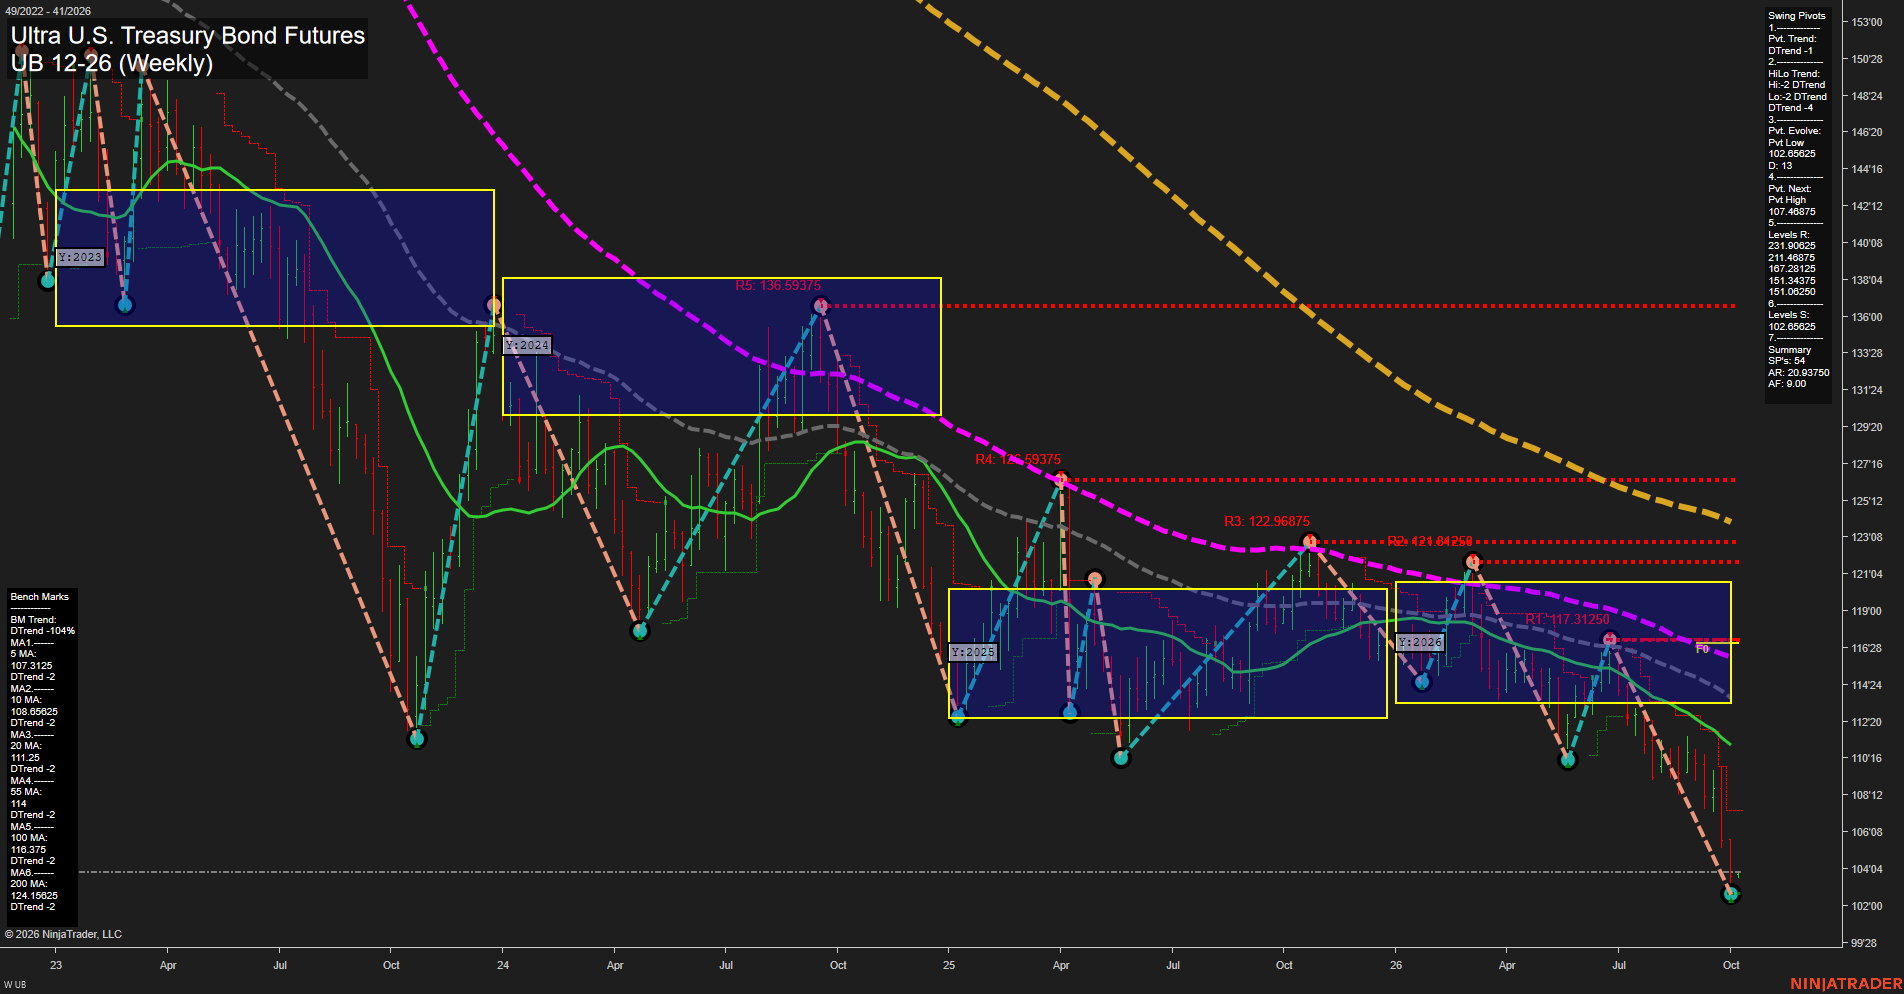
UB Ultra U.S. Treasury Bond Futures Weekly Chart Analysis: 2026-Oct-04 18:09 CT
Price Action
- Last: 103.0625,
- Bars: Large,
- Mom: fast.
WSFG Weekly
- Short-Term
- WSFG Current: -69%
- F0%/NTZ' Bias: Price Below,
- WSFG Trend: Down.
MSFG Month Oct
- Intermediate-Term
- MSFG Current: 3%
- F0%/NTZ' Bias: Price Above,
- MSFG Trend: Up.
YSFG Year 2026
- Long-Term
- YSFG Current: -38%
- F0%/NTZ' Bias: Price Below,
- YSFG Trend: Down.
Swing Pivots
- (Short-Term) 1. Pvt. Trend: DTrend,
- (Intermediate-Term) 2. HiLo Trend: DTrend,
- 3. Pvt. Evolve: Pvt low 102.0625,
- 4. Pvt. Next: Pvt high 107.46875,
- 5. Levels R: 231.90625, 211.46875, 167.28125, 153.4375, 151.06250,
- 6. Levels S: 102.65625.
Weekly Benchmarks
- (Short-Term) 5 Day: 107.3125 Down Trend,
- (Short-Term) 10 Day: 108.65625 Down Trend,
- (Intermediate-Term) 20 Day: 111.25 Down Trend,
- (Intermediate-Term) 55 Day: 114 Down Trend,
- (Long-Term) 100 Day: 116.375 Down Trend,
- (Long-Term) 200 Day: 124.15625 Down Trend.
Recent Trade Signals
- 02 Oct 2026: Long UB 12-26 @ 104.5 Signals.USAR-MSFG
- 28 Sep 2026: Short UB 12-26 @ 105.3125 Signals.USAR-WSFG
Overall Rating
- Short-Term: Bearish,
- Intermediate-Term: Bearish,
- Long-Term: Bearish.
Key Insights Summary
Weekly UB remains in a broad declining price cycle, with large-range selling driving price beneath every benchmark average and below the yearly F0% level. The monthly grid remains marginally positive, but this contrasts with the confirmed DTrend in both pivot measures and the sequence of lower highs and lower lows. The recent low near 102.0625 defines the active downside pivot, while 107.46875 is the next upside pivot-reversal threshold. The October long MSFG signal reflects a counter-trend bounce attempt, whereas the weekly short signal and uniformly declining moving-average structure retain the dominant bearish swing-trend character.
Chart Analysis ATS AI Generated: 2026-10-04 18:09 for Informational use only, not trading advice. Terms and Risk Disclosure Copyright © 2026. Algo Trading Systems LLC.