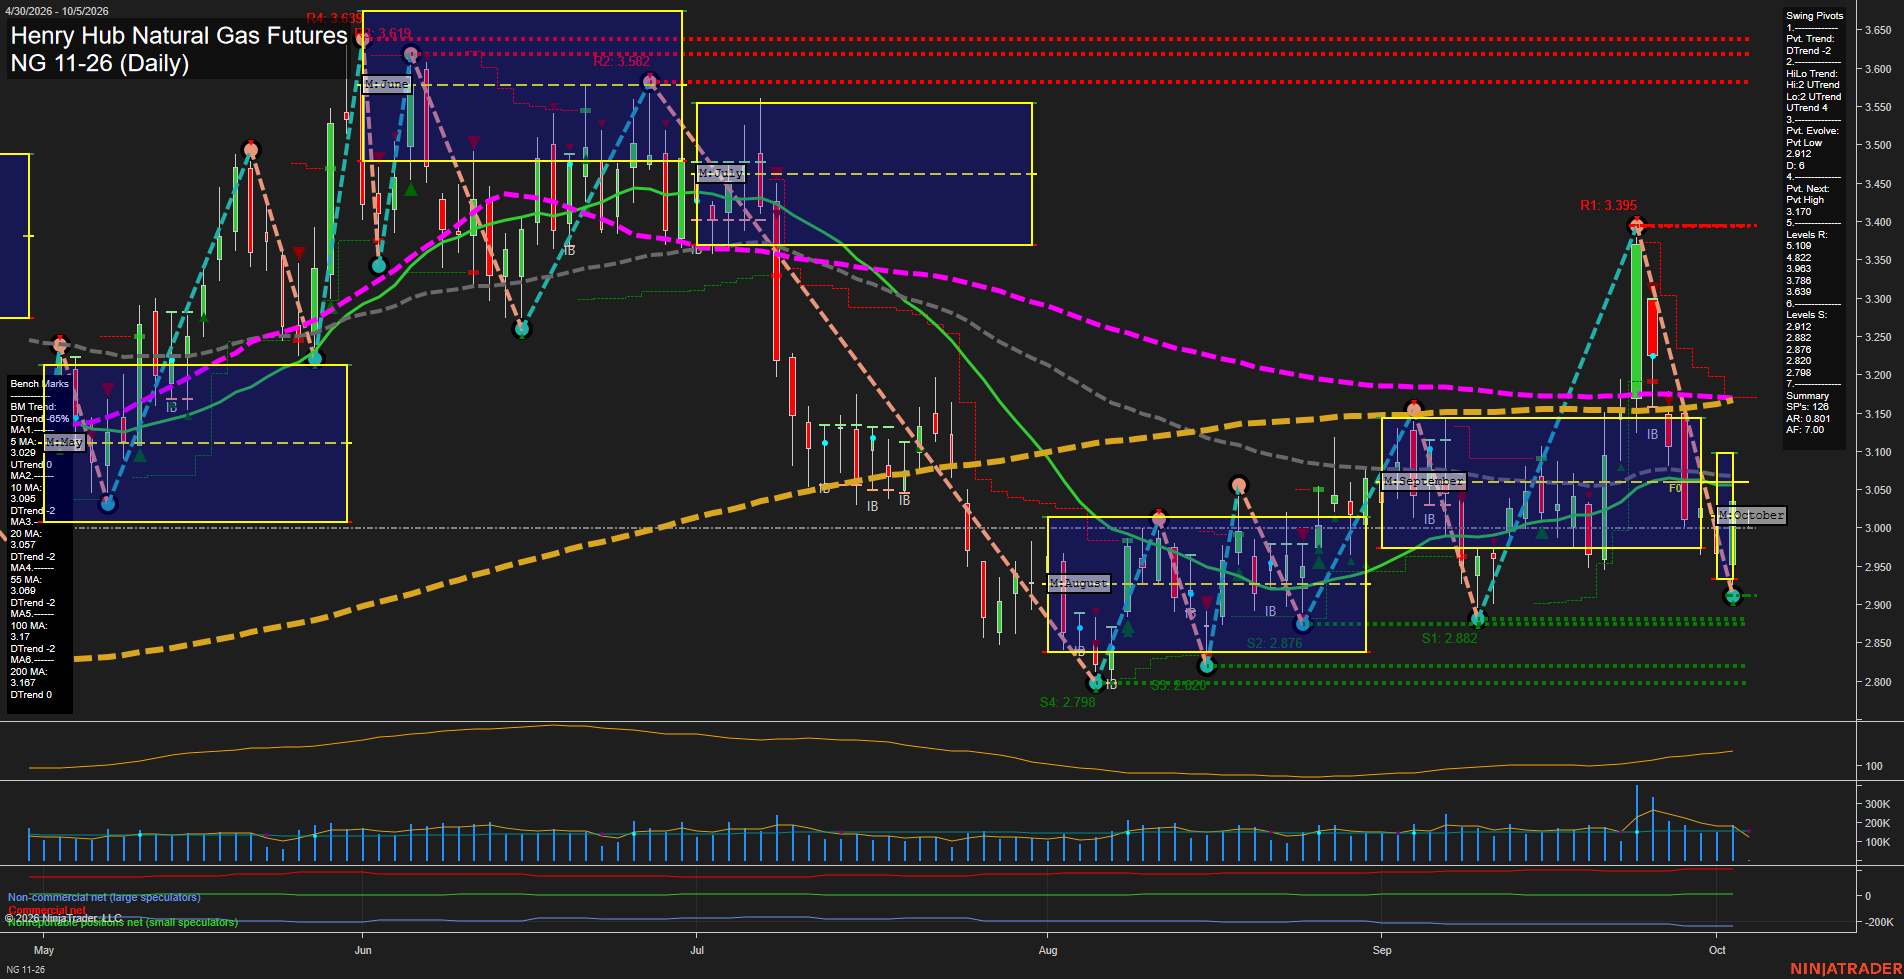
NG Henry Hub Natural Gas Futures Daily Chart Analysis: 2026-Oct-04 18:05 CT
Price Action
- Last: 2.901,
- Bars: Large,
- Mom: fast.
WSFG Weekly
- Short-Term
- WSFG Current: -8%
- F0%/NTZ' Bias: Price Below,
- WSFG Trend: Down.
MSFG Month Oct
- Intermediate-Term
- MSFG Current: 5%
- F0%/NTZ' Bias: Price Above,
- MSFG Trend: Up.
YSFG Year 2026
- Long-Term
- YSFG Current: 14%
- F0%/NTZ' Bias: Price Above,
- YSFG Trend: Up.
Swing Pivots
- (Short-Term) 1. Pvt. Trend: DTrend,
- (Intermediate-Term) 2. HiLo Trend: UTrend,
- 3. Pvt. Evolve: Pvt low 2.912,
- 4. Pvt. Next: Pvt high 3.170,
- 5. Levels R: 5.199, 4.822, 3.963, 3.786, 3.639,
- 6. Levels S: 2.912, 2.882, 2.876, 2.820, 2.798.
Daily Benchmarks
- (Short-Term) 5 Day: 3.020 Up Trend,
- (Short-Term) 10 Day: 3.095 Down Trend,
- (Intermediate-Term) 20 Day: 3.057 Down Trend,
- (Intermediate-Term) 55 Day: 3.069 Down Trend,
- (Long-Term) 100 Day: 3.177 Down Trend,
- (Long-Term) 200 Day: 3.167 Down Trend.
Additional Metrics
Recent Trade Signals
- 02 Oct 2026: Long NG 11-26 @ 3.041 Signals.USAR-MSFG
- 02 Oct 2026: Long NG 11-26 @ 3.025 Signals.USAR.TR120
- 01 Oct 2026: Short NG 11-26 @ 2.978 Signals.USAR.TR720
Overall Rating
- Short-Term: Bearish,
- Intermediate-Term: Neutral,
- Long-Term: Bearish.
Key Insights Summary
NG has transitioned from the late-September rally into a sharp, high-momentum selloff, falling below the 5, 10, 20, 55, 100, and 200-day benchmarks. The short-term pivot structure is bearish and price is below the weekly F0% area, while 2.912 through 2.798 defines a concentrated support zone. The monthly and yearly grids remain positive, and the intermediate HiLo structure remains upward, creating a counter-trend condition within broader benchmark weakness. The 3.020 to 3.170 benchmark and pivot area is the principal overhead recovery zone, with 3.395 the nearer major pivot resistance.
Chart Analysis ATS AI Generated: 2026-10-04 18:05 for Informational use only, not trading advice. Terms and Risk Disclosure Copyright © 2026. Algo Trading Systems LLC.