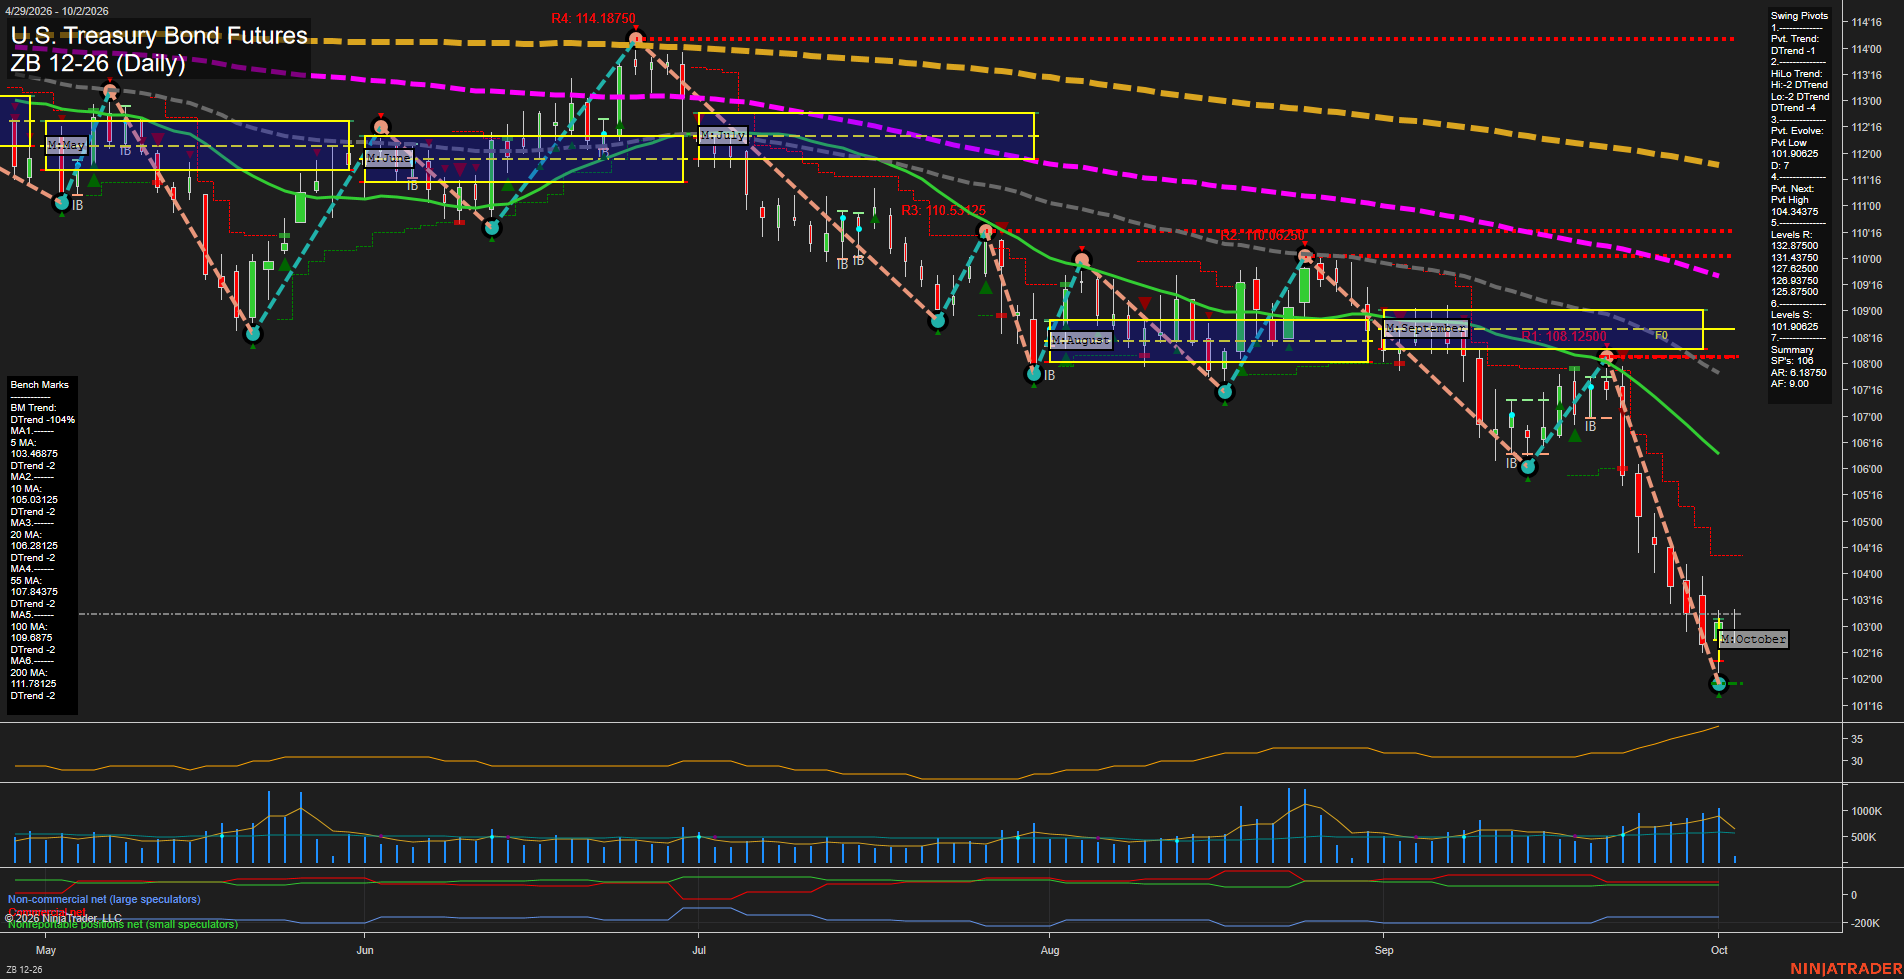
ZB U.S. Treasury Bond Futures Daily Chart Analysis: 2026-Oct-02 07:13 CT
Price Action
- Last: 103.03125,
- Bars: Large,
- Mom: fast.
WSFG Weekly
- Short-Term
- WSFG Current: -48%
- F0%/NTZ' Bias: Price Below,
- WSFG Trend: Down.
MSFG Month Oct
- Intermediate-Term
- MSFG Current: 9%
- F0%/NTZ' Bias: Price Above,
- MSFG Trend: Up.
YSFG Year 2026
- Long-Term
- YSFG Current: -49%
- F0%/NTZ' Bias: Price Below,
- YSFG Trend: Down.
Swing Pivots
- (Short-Term) 1. Pvt. Trend: DTrend,
- (Intermediate-Term) 2. HiLo Trend: DTrend,
- 3. Pvt. Evolve: Pvt low 101.90825,
- 4. Pvt. Next: Pvt high 104.34375,
- 5. Levels R: 132.87500, 131.43750, 127.62500, 126.93750, 125.87500,
- 6. Levels S: 101.90825.
Daily Benchmarks
- (Short-Term) 5 Day: 103.46875 Down Trend,
- (Short-Term) 10 Day: 105.03125 Down Trend,
- (Intermediate-Term) 20 Day: 106.28125 Down Trend,
- (Intermediate-Term) 55 Day: 107.84375 Down Trend,
- (Long-Term) 100 Day: 109.68750 Down Trend,
- (Long-Term) 200 Day: 111.78125 Down Trend.
Additional Metrics
Overall Rating
- Short-Term: Bearish,
- Intermediate-Term: Bearish,
- Long-Term: Bearish.
Key Insights Summary
The daily structure is decisively bearish: price is below every benchmark average, the pivot and HiLo trends remain in DTrend alignment, and the recent decline has expanded with large bars and elevated volatility. The October monthly grid reflects a local countertrend position above its F0% area, but it has not altered the broader sequence of lower highs and lower lows. The 101.90825 pivot low defines the current downside extreme, while 104.34375 is the first pivot-reversal reference above price. Volume increased into the late-September to early-October selloff, consistent with persistent downside momentum rather than a completed basing pattern.
Chart Analysis ATS AI Generated: 2026-10-02 07:13 for Informational use only, not trading advice. Terms and Risk Disclosure Copyright © 2026. Algo Trading Systems LLC.