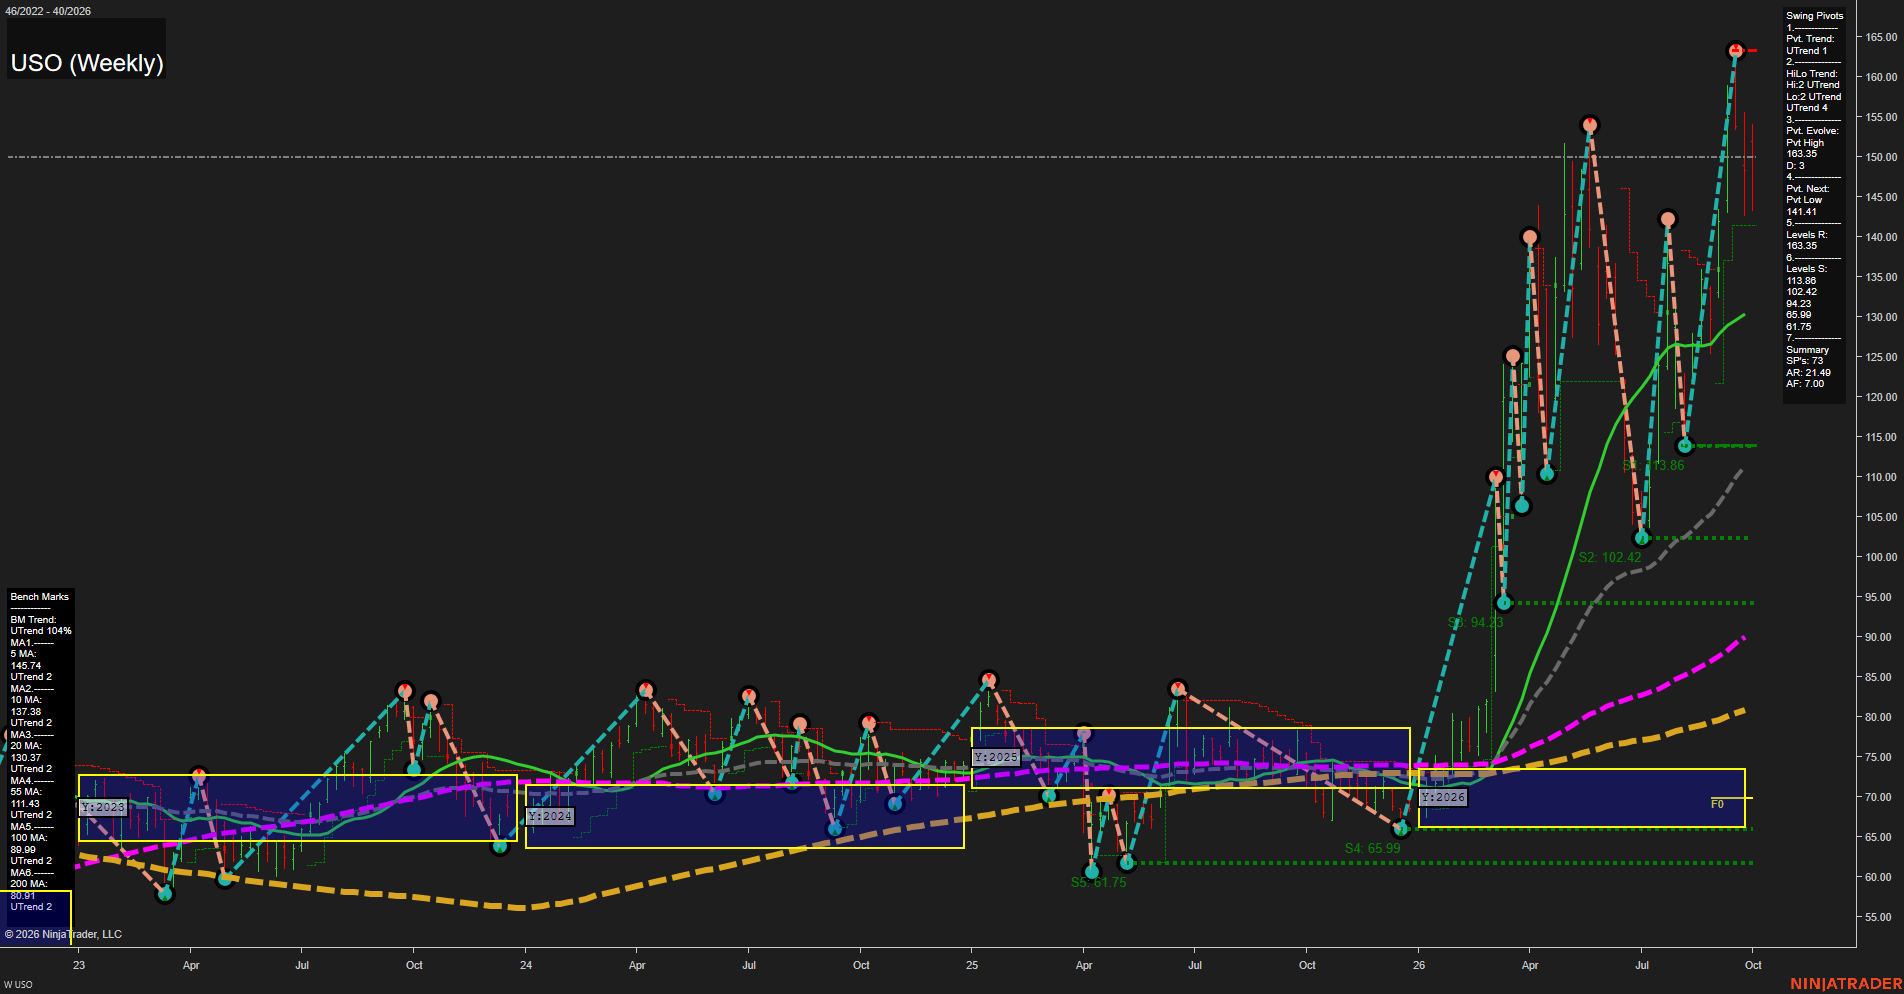
USO United States Oil Fund LP Weekly Chart Analysis: 2026-Oct-02 07:12 CT
Price Action
- Last: 143.35,
- Bars: Large,
- Mom: fast.
WSFG Weekly
- Short-Term
- WSFG Current: NA%
- F0%/NTZ' Bias: Price Above NTZ,
- WSFG Trend: UTrend.
MSFG Month Oct
- Intermediate-Term
- MSFG Current: NA%
- F0%/NTZ' Bias: Price Above NTZ,
- MSFG Trend: UTrend.
YSFG Year 2026
- Long-Term
- YSFG Current: NA%
- F0%/NTZ' Bias: Price Above NTZ,
- YSFG Trend: UTrend.
Swing Pivots
- (Short-Term) 1. Pvt. Trend: UTrend,
- (Intermediate-Term) 2. HiLo Trend: UTrend,
- 3. Pvt. Evolve: Pvt high 163.35,
- 4. Pvt. Next: Pvt low 141.41,
- 5. Levels R: 163.35,
- 6. Levels S: 113.86, 102.42, 94.23, 65.99, 61.75.
Weekly Benchmarks
- (Short-Term) 5 Day: 145.74 Up Trend,
- (Short-Term) 10 Day: 137.38 Up Trend,
- (Intermediate-Term) 20 Day: 130.37 Up Trend,
- (Intermediate-Term) 55 Day: 111.43 Up Trend,
- (Long-Term) 100 Day: 89.99 Up Trend,
- (Long-Term) 200 Day: 80.80 Up Trend.
Overall Rating
- Short-Term: Bullish,
- Intermediate-Term: Bullish,
- Long-Term: Bullish.
Key Insights Summary
USO reflects an exceptionally strong oil-linked futures swing structure: price remains far above the yearly NTZ and all rising weekly benchmarks, while both pivot trends remain in UTrend. The sharp advance to the 163.35 pivot high has been followed by a large-range retracement toward 143.35, placing short-term momentum in a fast, volatile consolidation phase rather than altering the broader higher-high and higher-low structure. The 141.41 pivot-next level defines the immediate structural inflection, with 163.35 remaining the principal overhead pivot resistance. Beneath that, the wide separation between price and the 20-, 55-, 100-, and 200-week benchmarks confirms a powerful longer-cycle expansion following the prior multi-year base.
Chart Analysis ATS AI Generated: 2026-10-02 07:12 for Informational use only, not trading advice. Terms and Risk Disclosure Copyright © 2026. Algo Trading Systems LLC.