SPI ASX SPI 200 Index Futures Weekly Chart Analysis: 2026-Oct-02 07:10 CT
Price Action
- Last: 8737,
- Bars: Medium,
- Mom: Average.
WSFG Weekly
- Short-Term
- WSFG Current: NA%
- F0%/NTZ' Bias: Price Neutral,
- WSFG Trend: DTrend.
MSFG Month Oct
- Intermediate-Term
- MSFG Current: NA%
- F0%/NTZ' Bias: Price Neutral,
- MSFG Trend: Neutral.
YSFG Year 2026
- Long-Term
- YSFG Current: NA%
- F0%/NTZ' Bias: Price Neutral,
- YSFG Trend: Neutral.
Swing Pivots
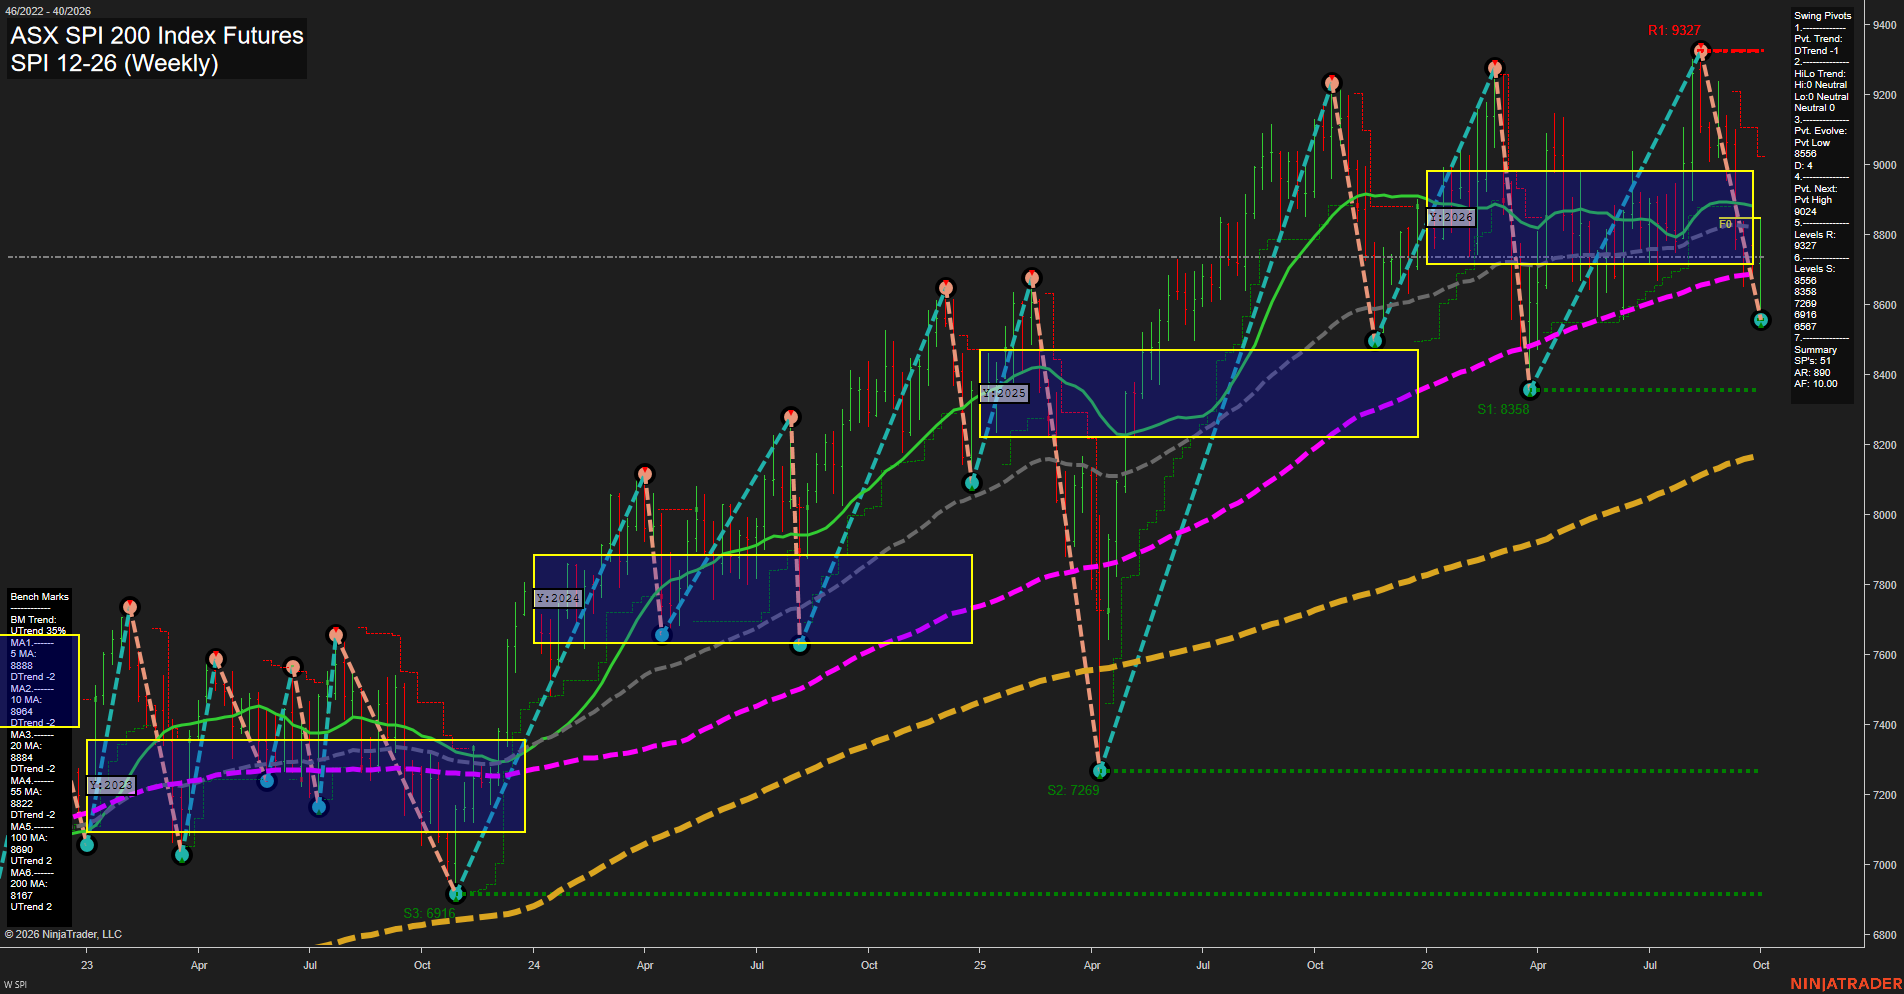
- (Short-Term) 1. Pvt. Trend: DTrend,
- (Intermediate-Term) 2. HiLo Trend: UTrend,
- 3. Pvt. Evolve: Pvt low 8556,
- 4. Pvt. Next: Pvt high 9024,
- 5. Levels R: 9327, 9024,
- 6. Levels S: 8558, 8358, 7269, 6916, 6567.
Weekly Benchmarks
- (Short-Term) 5 Day: 8790 Up Trend,
- (Short-Term) 10 Day: 8964 Down Trend,
- (Intermediate-Term) 20 Day: 8848 Down Trend,
- (Intermediate-Term) 55 Day: 8822 Down Trend,
- (Long-Term) 100 Day: 8690 Up Trend,
- (Long-Term) 200 Day: 8167 Up Trend.
Overall Rating
- Short-Term: Bearish,
- Intermediate-Term: Neutral,
- Long-Term: Bullish.
Key Insights Summary
SPI futures remain in a short-term corrective downswing after rejection from the 9327 swing high, with the active pivot low at 8556 defining the recent sell-off extreme. Price has bounced above the 100-week benchmark near 8690, but remains below the declining 10, 20 and 55-week averages, leaving the recovery structure incomplete. The intermediate pivot sequence remains constructive through higher-degree support, while the long-term trend retains a bullish foundation above the rising 100 and 200-week benchmarks. The 8558 support area and 9024 pivot-reversal level frame the current consolidation range, with 9327 remaining the major overhead swing resistance.
Chart Analysis ATS AI Generated: 2026-10-02 07:11 for Informational use only, not trading advice. Terms and Risk Disclosure Copyright © 2026. Algo Trading Systems LLC.