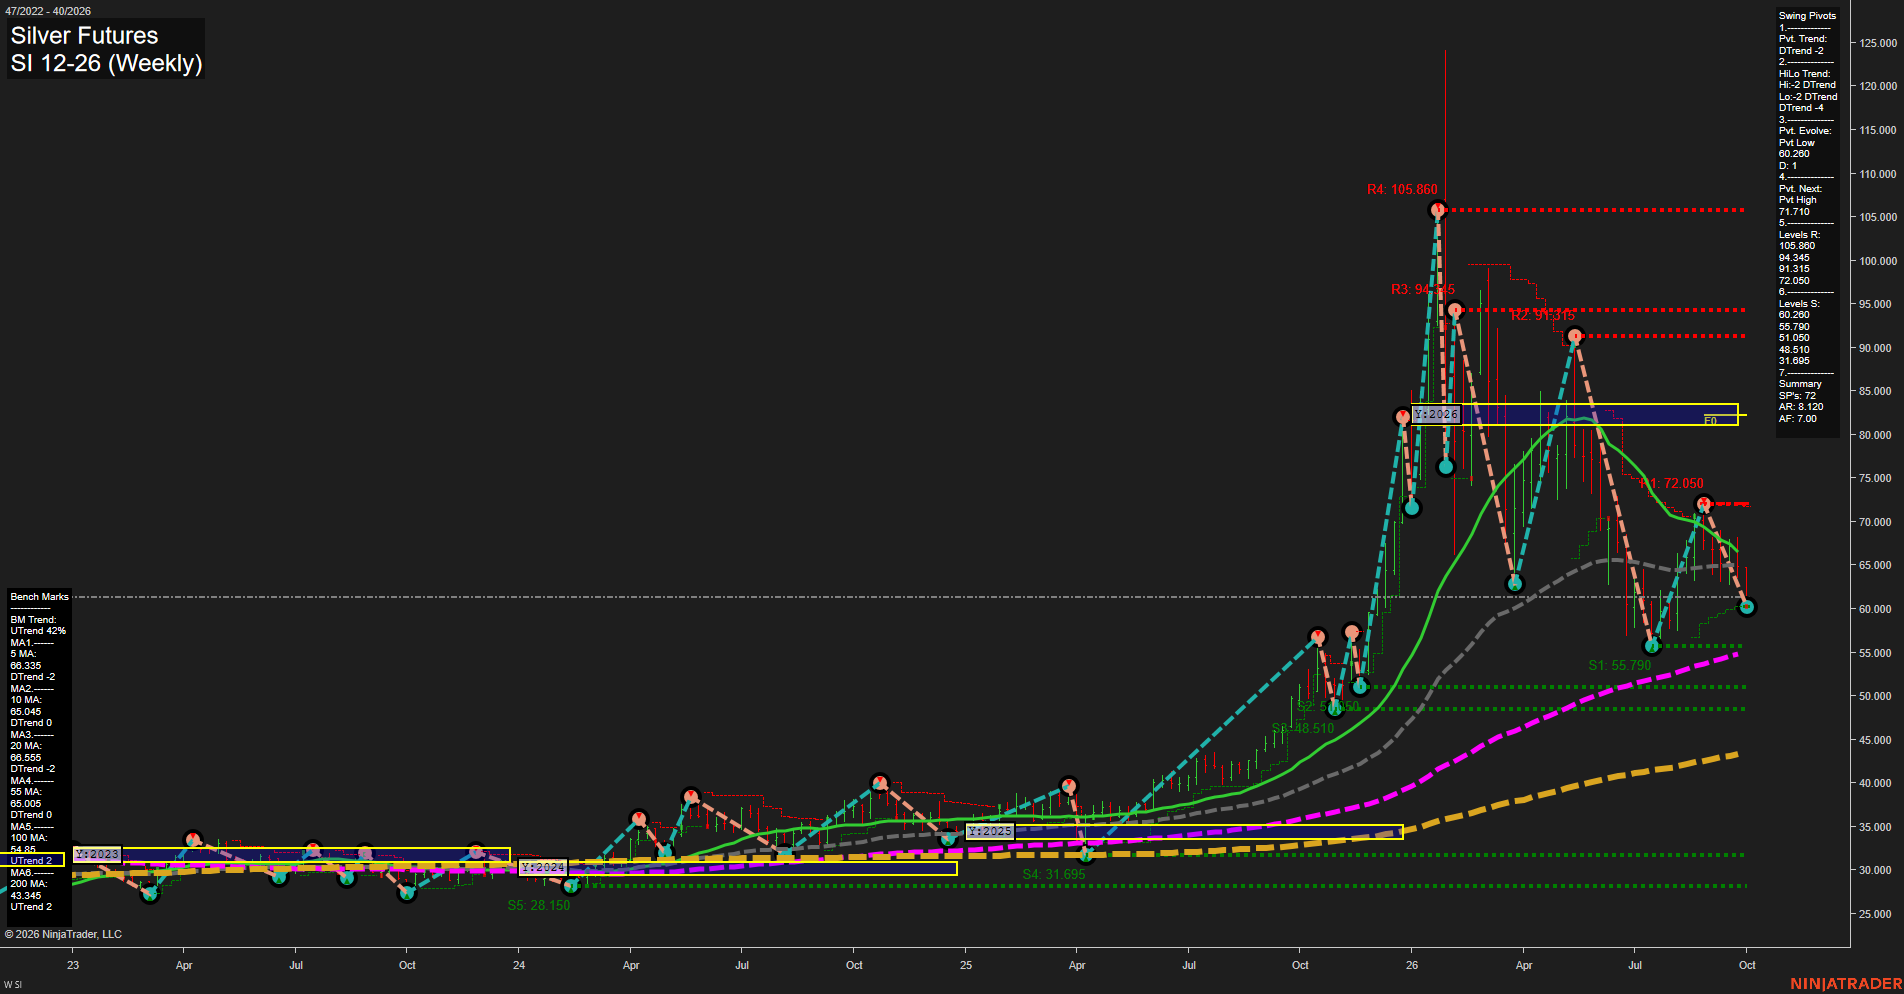
SI Silver Futures Weekly Chart Analysis: 2026-Oct-02 07:10 CT
Price Action
- Last: 60.260,
- Bars: Medium,
- Mom: fast.
WSFG Weekly
- Short-Term
- WSFG Current: -66%
- F0%/NTZ' Bias: Price Below,
- WSFG Trend: Down.
MSFG Month Oct
- Intermediate-Term
- MSFG Current: 0%
- F0%/NTZ' Bias: Price Neutral,
- MSFG Trend: Neutral.
YSFG Year 2026
- Long-Term
- YSFG Current: -171%
- F0%/NTZ' Bias: Price Below,
- YSFG Trend: Down.
Swing Pivots
- (Short-Term) 1. Pvt. Trend: DTrend,
- (Intermediate-Term) 2. HiLo Trend: DTrend,
- 3. Pvt. Evolve: Pvt low 60.260,
- 4. Pvt. Next: Pvt high 71.710,
- 5. Levels R: 105.860, 94.345, 91.315, 72.050,
- 6. Levels S: 60.260, 55.790, 51.050, 48.510, 31.695.
Weekly Benchmarks
- (Short-Term) 5 Day: 68.350 Down Trend,
- (Short-Term) 10 Day: 65.045 Down Trend,
- (Intermediate-Term) 20 Day: 66.550 Down Trend,
- (Intermediate-Term) 55 Day: 65.005 Down Trend,
- (Long-Term) 100 Day: 54.850 Up Trend,
- (Long-Term) 200 Day: 43.345 Up Trend.
Recent Trade Signals
- 28 Sep 2026: Short SI 12-26 @ 64.14 Signals.USAR-MSFG
Overall Rating
- Short-Term: Bearish,
- Intermediate-Term: Bearish,
- Long-Term: Neutral.
Key Insights Summary
Silver’s weekly structure remains in a sharp corrective decline following the prior high-volatility advance. Price is beneath the short and intermediate benchmark cluster near 65.005 to 68.350, with a confirmed short-term and intermediate-term DTrend. The 60.260 pivot low is the immediate structural support, while 71.710 is the next upside pivot-reversal threshold. Longer-term moving averages remain rising beneath price, but the yearly fib position below F0% and the large retracement from the 105.860 peak keep the broader swing picture neutral rather than constructive.
Chart Analysis ATS AI Generated: 2026-10-02 07:10 for Informational use only, not trading advice. Terms and Risk Disclosure Copyright © 2026. Algo Trading Systems LLC.