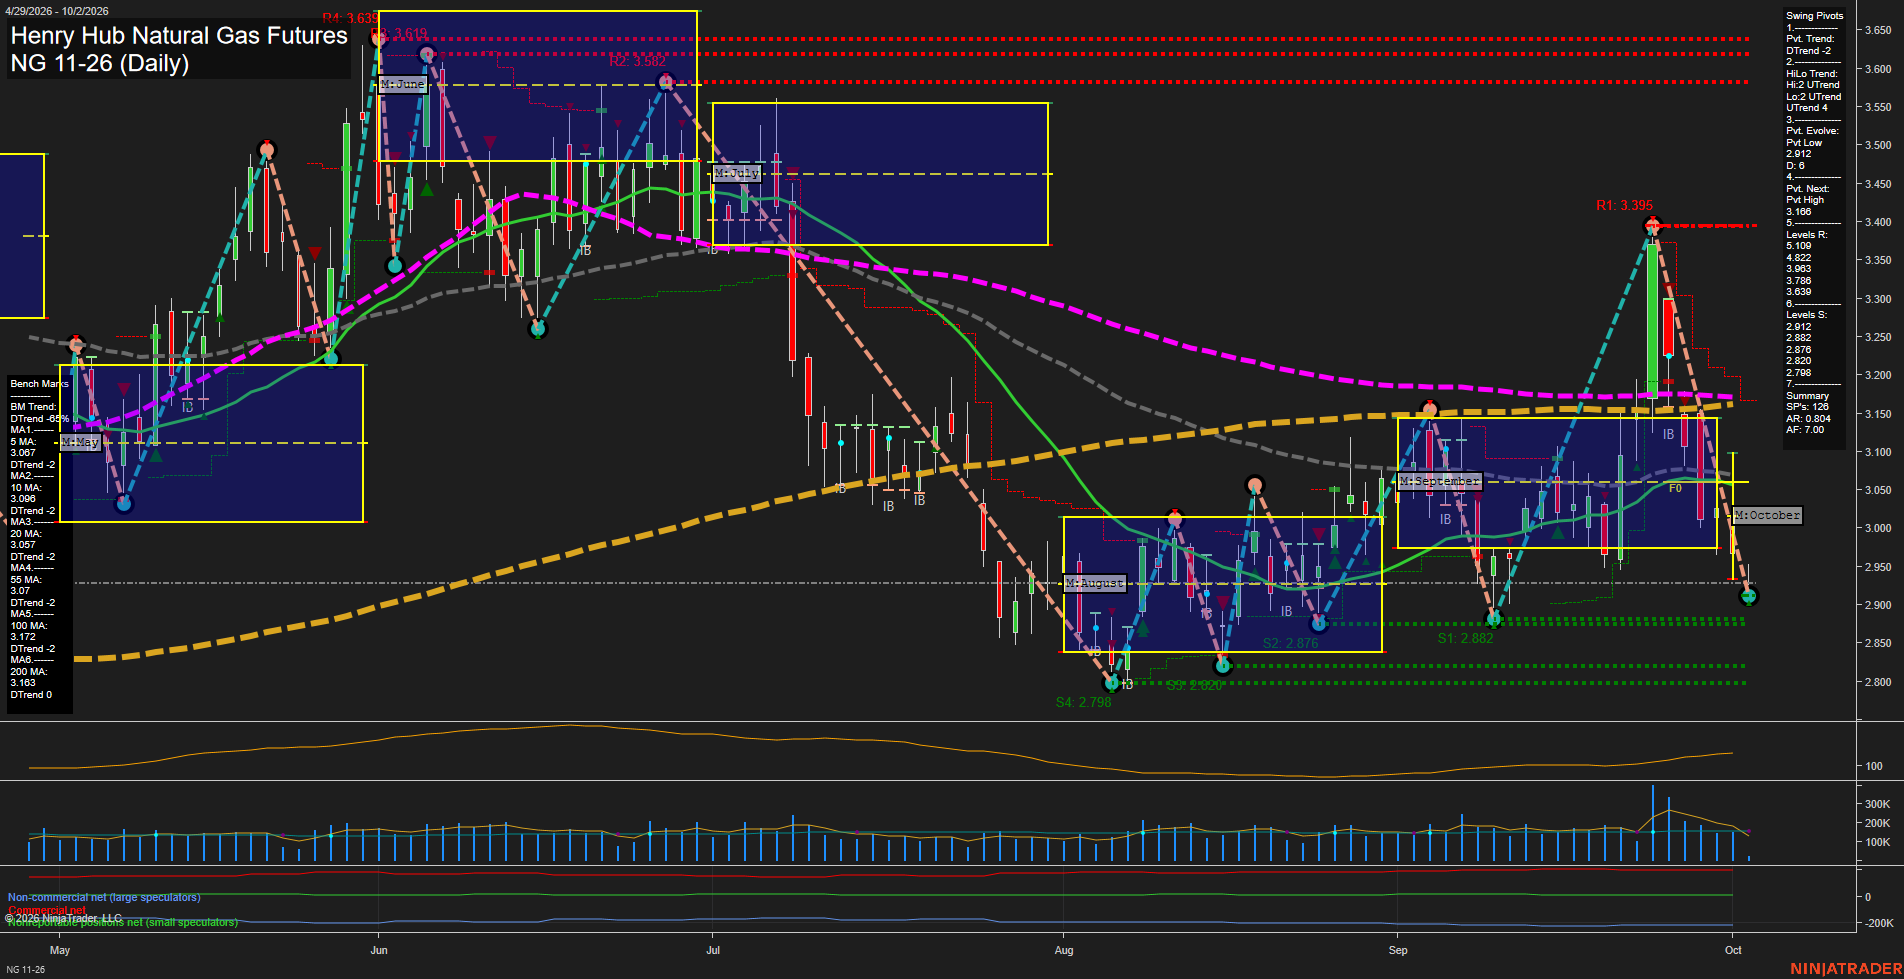
NG Henry Hub Natural Gas Futures Daily Chart Analysis: 2026-Oct-02 07:06 CT
Price Action
- Last: 2.912,
- Bars: Medium,
- Mom: Fast.
WSFG Weekly
- Short-Term
- WSFG Current: -88%
- F0%/NTZ' Bias: Price Below,
- WSFG Trend: Down.
MSFG Month Oct
- Intermediate-Term
- MSFG Current: -10%
- F0%/NTZ' Bias: Price Below,
- MSFG Trend: Down.
YSFG Year 2026
- Long-Term
- YSFG Current: 11%
- F0%/NTZ' Bias: Price Above,
- YSFG Trend: Up.
Swing Pivots
- (Short-Term) 1. Pvt. Trend: DTrend,
- (Intermediate-Term) 2. HiLo Trend: UTrend,
- 3. Pvt. Evolve: Pvt low 2.912,
- 4. Pvt. Next: Pvt high 3.166,
- 5. Levels R: 5.199, 4.822, 3.903, 3.786, 3.639,
- 6. Levels S: 2.912, 2.882, 2.876, 2.820, 2.798.
Daily Benchmarks
- (Short-Term) 5 Day: 3.067 Down Trend,
- (Short-Term) 10 Day: 3.096 Down Trend,
- (Intermediate-Term) 20 Day: 3.057 Down Trend,
- (Intermediate-Term) 55 Day: 3.070 Down Trend,
- (Long-Term) 100 Day: 3.172 Down Trend,
- (Long-Term) 200 Day: 3.163 Down Trend.
Additional Metrics
Recent Trade Signals
- 02 Oct 2026: Short NG 11-26 @ 2.919 Signals.USAR-MSFG
- 01 Oct 2026: Short NG 11-26 @ 2.978 Signals.USAR.TR720
Overall Rating
- Short-Term: Bearish,
- Intermediate-Term: Bearish,
- Long-Term: Neutral.
Key Insights Summary
NG has undergone a sharp reversal from the late-September 3.395 pivot high, with fast downside momentum carrying price beneath the weekly and October monthly F0% areas and below every displayed benchmark average. The 2.912 pivot low is the immediate focal support, followed closely by the 2.882 to 2.876 support band; the broader pivot structure remains intermediate-term constructive but is under countertrend pressure. A recovery would first encounter the 3.057 to 3.096 moving-average cluster, while the next pivot reversal level is 3.166. Elevated daily range relative to price reflects an active, volatile seasonal transition.
Chart Analysis ATS AI Generated: 2026-10-02 07:07 for Informational use only, not trading advice. Terms and Risk Disclosure Copyright © 2026. Algo Trading Systems LLC.