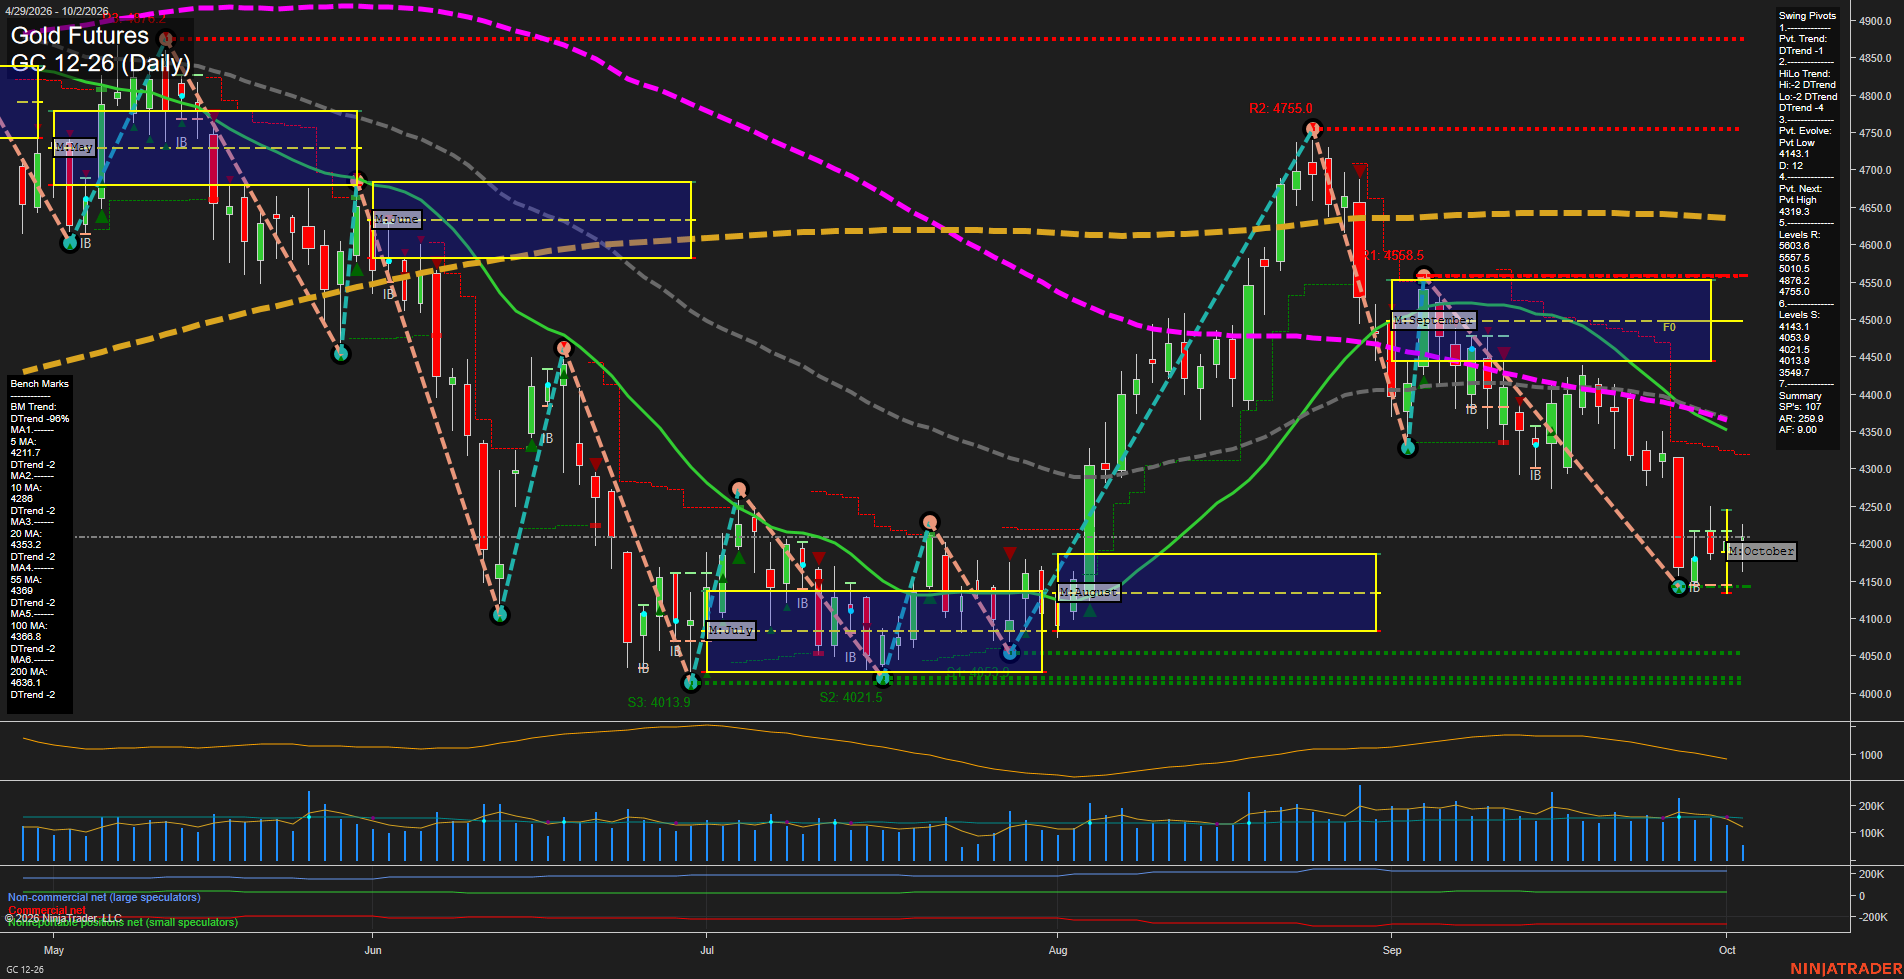
GC Gold Futures Daily Chart Analysis: 2026-Oct-02 07:05 CT
Price Action
- Last: 4211,
- Bars: Small,
- Mom: Slow.
WSFG Weekly
- Short-Term
- WSFG Current: -61%
- F0%/NTZ' Bias: Price Below,
- WSFG Trend: Down.
MSFG Month Oct
- Intermediate-Term
- MSFG Current: 1%
- F0%/NTZ' Bias: Price Above,
- MSFG Trend: Up.
YSFG Year 2026
- Long-Term
- YSFG Current: -101%
- F0%/NTZ' Bias: Price Below,
- YSFG Trend: Down.
Swing Pivots
- (Short-Term) 1. Pvt. Trend: DTrend,
- (Intermediate-Term) 2. HiLo Trend: DTrend,
- 3. Pvt. Evolve: Pvt low 4153.1,
- 4. Pvt. Next: Pvt high 4319.3,
- 5. Levels R: 5683.6, 5597.5, 5010.5, 4876.0, 4755.0,
- 6. Levels S: 4143.1, 4053.9, 4021.5, 4013.9, 3549.7.
Daily Benchmarks
- (Short-Term) 5 Day: 4211.7 Down Trend,
- (Short-Term) 10 Day: 4286 Down Trend,
- (Intermediate-Term) 20 Day: 4353 Down Trend,
- (Intermediate-Term) 55 Day: 4369 Down Trend,
- (Long-Term) 100 Day: 4386 Down Trend,
- (Long-Term) 200 Day: 4638 Down Trend.
Additional Metrics
- ATR: 259.9,
- VOLMA: 182966.
Overall Rating
- Short-Term: Bearish,
- Intermediate-Term: Bearish,
- Long-Term: Bearish.
Key Insights Summary
Gold is consolidating just above the 4153.1 pivot low after a sharp September decline, with small daily bars reflecting slower downside momentum. The short-term pivot and HiLo structures remain in DTrend, while price is below every daily benchmark from the 5-day through 200-day average. October MSFG is marginally above its F0% level, creating a counter-trend stabilization theme, but the weekly and yearly Fib-grid readings remain negative. The 4319.3 pivot-high reversal level and clustered 4353-4386 moving-average zone define the nearest overhead trend-recovery area, while 4143.1 and the 4054-4014 support cluster remain the principal downside structure.
Chart Analysis ATS AI Generated: 2026-10-02 07:06 for Informational use only, not trading advice. Terms and Risk Disclosure Copyright © 2026. Algo Trading Systems LLC.