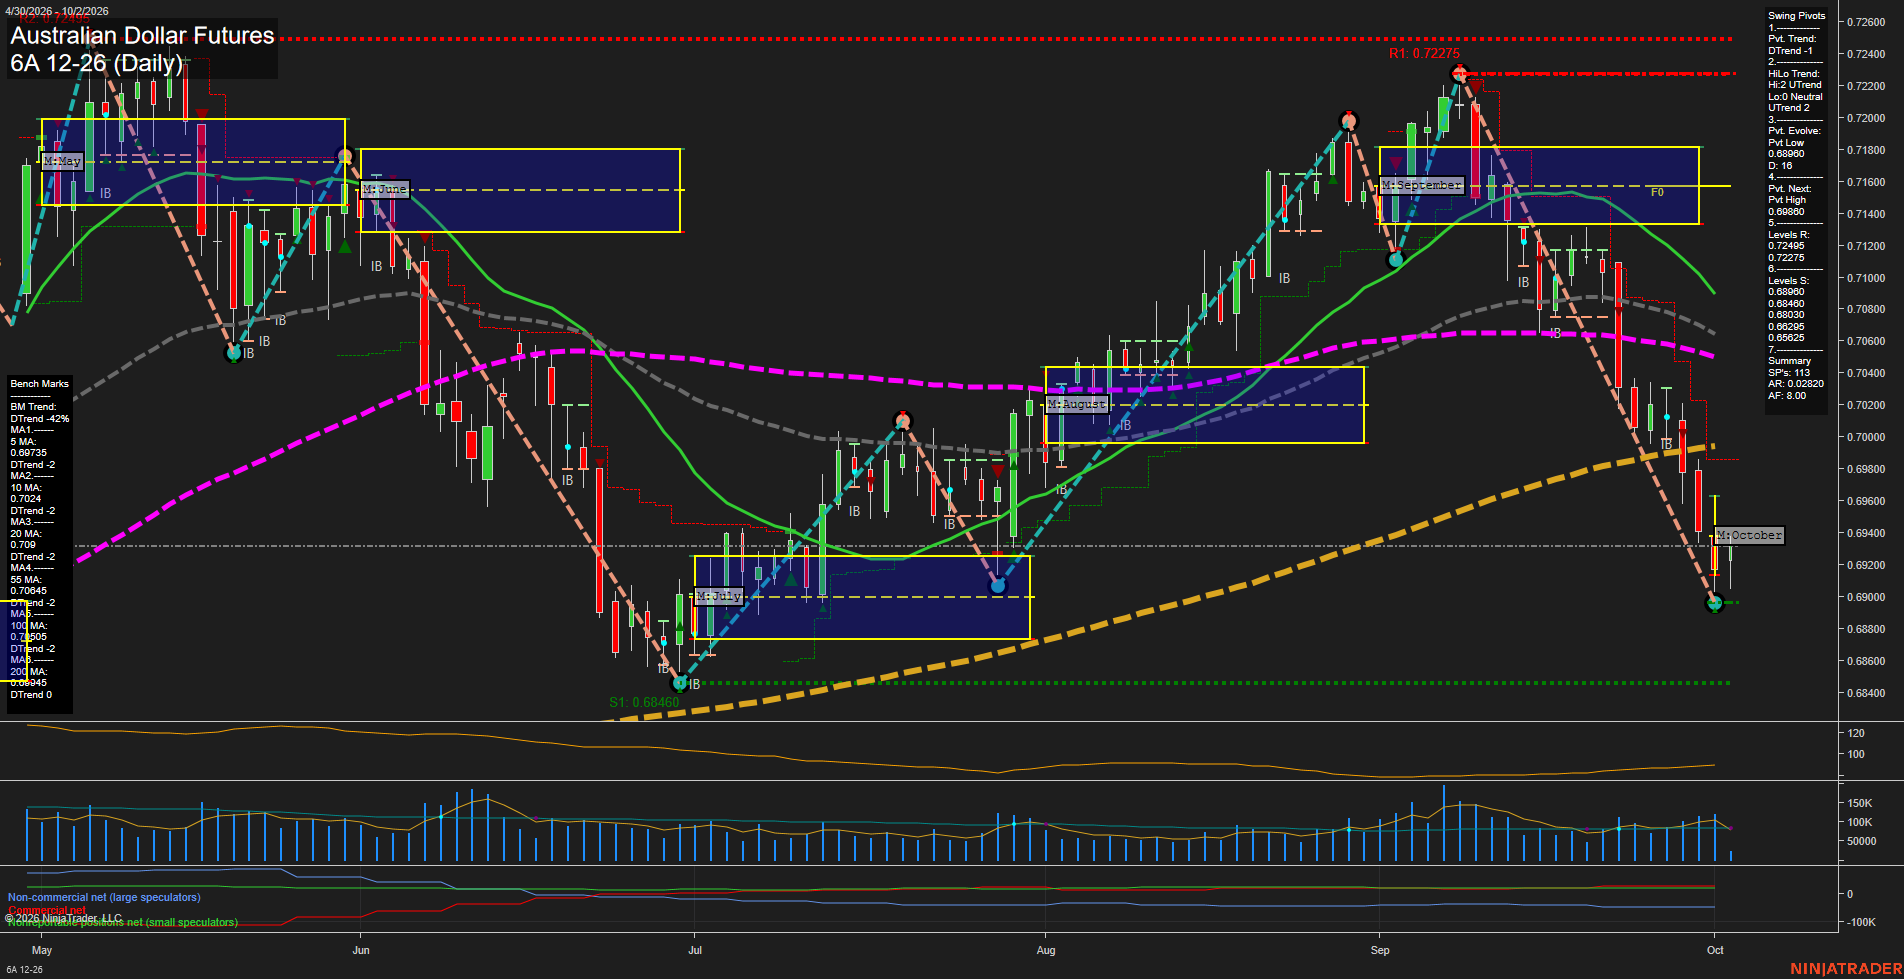
6A Australian Dollar Futures Daily Chart Analysis: 2026-Oct-02 07:00 CT
Price Action
- Last: 0.69315,
- Bars: Medium,
- Mom: Slow.
WSFG Weekly
- Short-Term
- WSFG Current: -76%
- F0%/NTZ' Bias: Price Below,
- WSFG Trend: Down.
MSFG Month Oct
- Intermediate-Term
- MSFG Current: -5%
- F0%/NTZ' Bias: Price Below,
- MSFG Trend: Down.
YSFG Year 2026
- Long-Term
- YSFG Current: 24%
- F0%/NTZ' Bias: Price Above,
- YSFG Trend: Up.
Swing Pivots
- (Short-Term) 1. Pvt. Trend: DTrend,
- (Intermediate-Term) 2. HiLo Trend: UTrend,
- 3. Pvt. Evolve: Pvt low 0.68900,
- 4. Pvt. Next: Pvt high 0.69890,
- 5. Levels R: 0.72495, 0.72275,
- 6. Levels S: 0.68960, 0.68480, 0.68010, 0.66295, 0.65625.
Daily Benchmarks
- (Short-Term) 5 Day: 0.69735 Down Trend,
- (Short-Term) 10 Day: 0.70240 Down Trend,
- (Intermediate-Term) 20 Day: 0.70942 Down Trend,
- (Intermediate-Term) 55 Day: 0.70645 Down Trend,
- (Long-Term) 100 Day: 0.70605 Down Trend,
- (Long-Term) 200 Day: 0.69450 Up Trend.
Additional Metrics
Recent Trade Signals
- 02 Oct 2026: Short 6A 12-26 @ 0.69115 Signals.USAR-MSFG
Overall Rating
- Short-Term: Bearish,
- Intermediate-Term: Bearish,
- Long-Term: Neutral.
Key Insights Summary
Price has staged a modest bounce from the 0.68900 swing-low area, but remains below the declining 5, 10, 20, 55, and 100-day benchmarks. The weekly and monthly fib grids remain below their respective F0% levels, confirming a short- and intermediate-term downside structure. The 0.69890 pivot threshold defines the next upside reversal point, while 0.68960 and the larger 0.68480 support area frame the recent low. The yearly grid remains positive and price is near the 200-day benchmark, leaving the longer-term structure neutral despite the current corrective selloff.
Chart Analysis ATS AI Generated: 2026-10-02 07:00 for Informational use only, not trading advice. Terms and Risk Disclosure Copyright © 2026. Algo Trading Systems LLC.