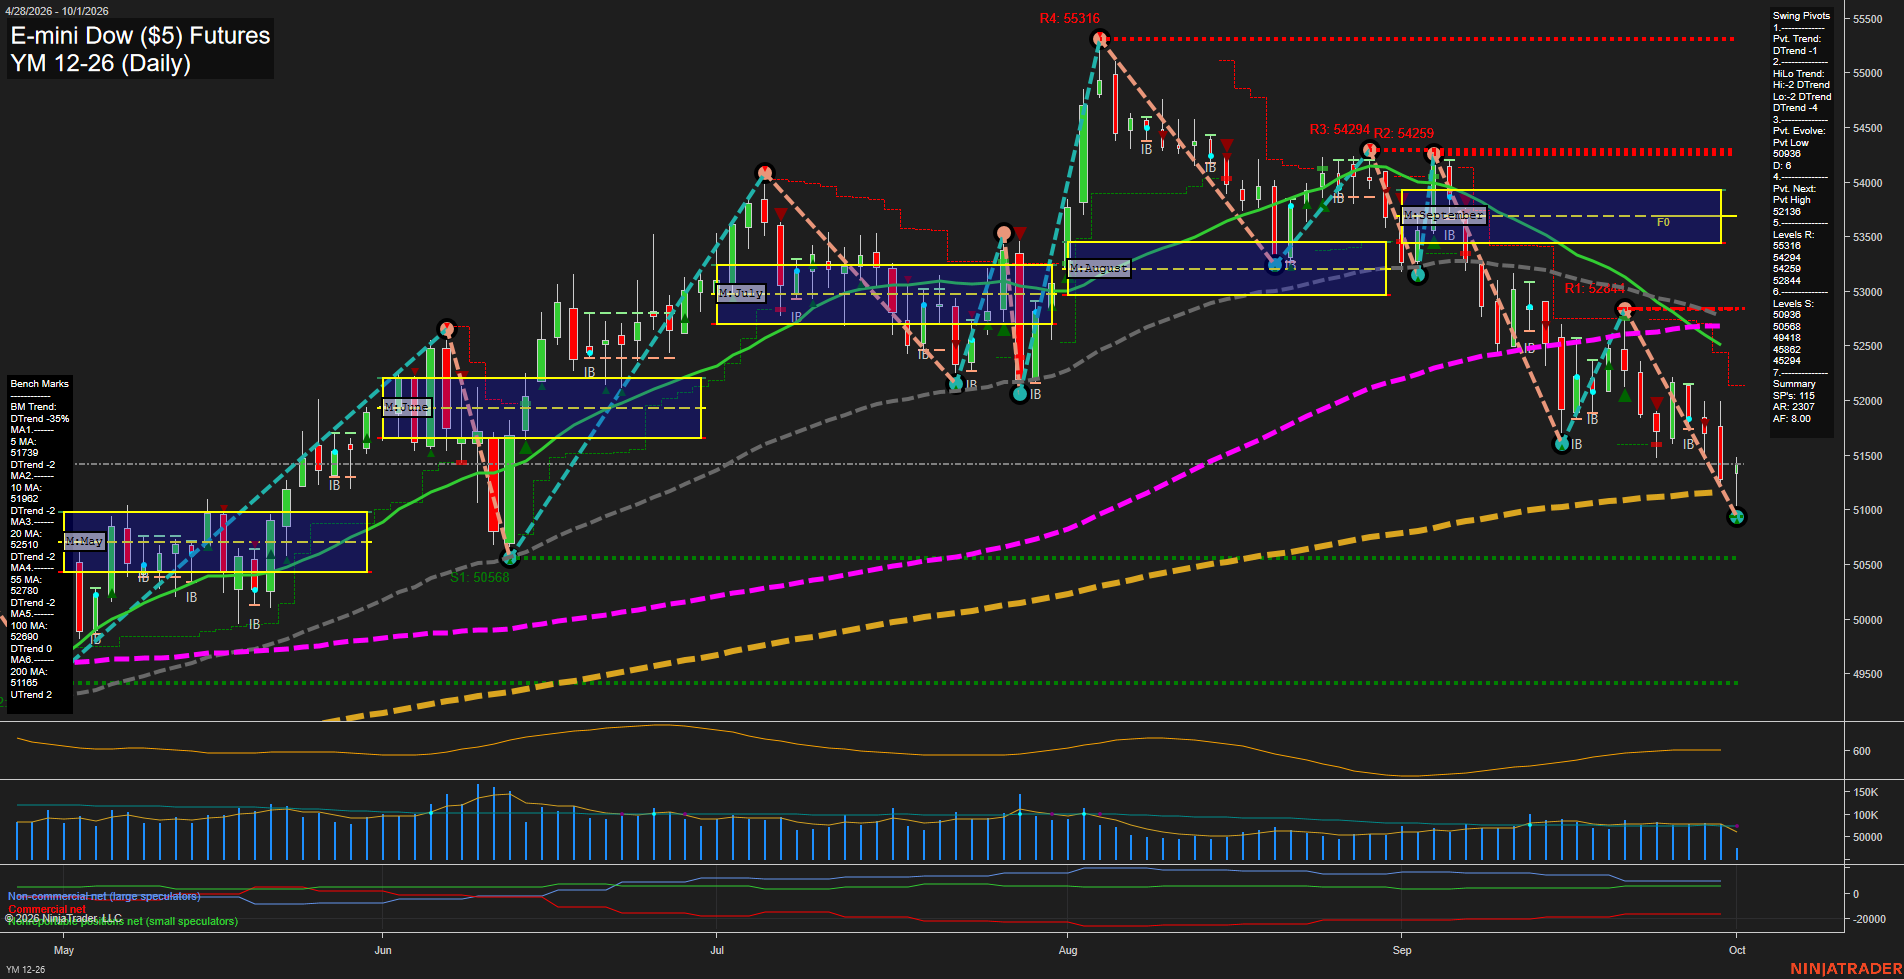
YM E-mini Dow ($5) Futures Daily Chart Analysis: 2026-Oct-01 07:12 CT
Price Action
- Last: 51442,
- Bars: Medium,
- Mom: fast.
WSFG Weekly
- Short-Term
- WSFG Current: -54%
- F0%/NTZ' Bias: Price Below,
- WSFG Trend: Down.
MSFG Month Oct
- Intermediate-Term
- MSFG Current: 2%
- F0%/NTZ' Bias: Price Above,
- MSFG Trend: Up.
YSFG Year 2026
- Long-Term
- YSFG Current: 18%
- F0%/NTZ' Bias: Price Above,
- YSFG Trend: Up.
Swing Pivots
- (Short-Term) 1. Pvt. Trend: DTrend,
- (Intermediate-Term) 2. HiLo Trend: DTrend,
- 3. Pvt. Evolve: Pvt low 50938,
- 4. Pvt. Next: Pvt high 52138,
- 5. Levels R: 55316, 54294, 54259, 52848,
- 6. Levels S: 50938, 50568, 49418.
Daily Benchmarks
- (Short-Term) 5 Day: 51739 Down Trend,
- (Short-Term) 10 Day: 51982 Down Trend,
- (Intermediate-Term) 20 Day: 52511 Down Trend,
- (Intermediate-Term) 55 Day: 52780 Down Trend,
- (Long-Term) 100 Day: 52690 Down Trend,
- (Long-Term) 200 Day: 51165 Up Trend.
Additional Metrics
Recent Trade Signals
- 01 Oct 2026: Short YM 12-26 @ 51011 Signals.USAR-MSFG
- 29 Sep 2026: Short YM 12-26 @ 51498 Signals.USAR.TR120
- 29 Sep 2026: Short YM 12-26 @ 51865 Signals.USAR-WSFG
Overall Rating
- Short-Term: Bearish,
- Intermediate-Term: Bearish,
- Long-Term: Bullish.
Key Insights Summary
YM remains in a sharp short-term downswing, with price below the 5, 10, 20, 55, and 100-day benchmarks and both pivot trend measures in DTrend. The decline from the September high near 54259 has produced lower highs and lower lows, with 52138 defining the next upside pivot-reversal threshold. Price is testing the 50938 pivot-low area while remaining marginally above the rising 200-day benchmark at 51165. The monthly and yearly grids retain an upward bias, framing the current selloff as a countertrend retracement within the broader long-term uptrend; however, short and intermediate momentum remain decisively negative.
Chart Analysis ATS AI Generated: 2026-10-01 07:13 for Informational use only, not trading advice. Terms and Risk Disclosure Copyright © 2026. Algo Trading Systems LLC.