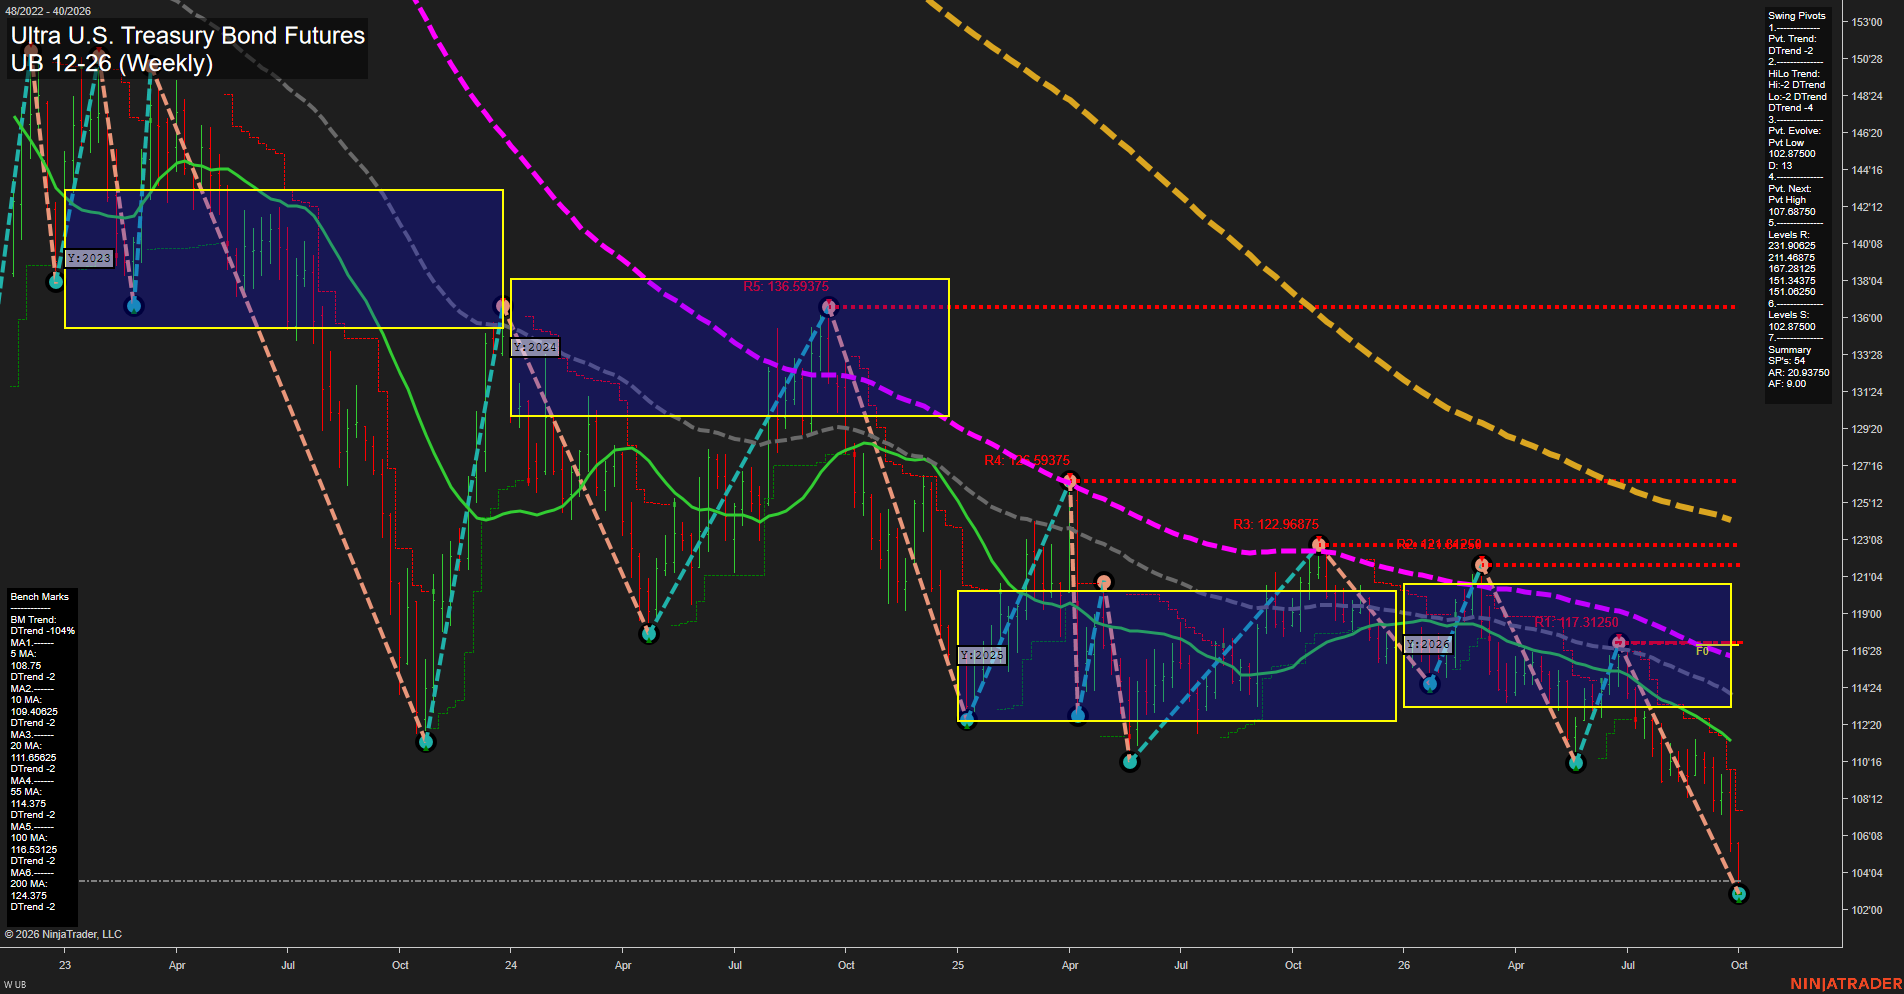
UB Ultra U.S. Treasury Bond Futures Weekly Chart Analysis: 2026-Oct-01 07:12 CT
Price Action
- Last: 102.9375,
- Bars: Large,
- Mom: Momentum fast.
WSFG Weekly
- Short-Term
- WSFG Current: -74%
- F0%/NTZ' Bias: Price Below,
- WSFG Trend: Down.
MSFG Month Oct
- Intermediate-Term
- MSFG Current: -1%
- F0%/NTZ' Bias: Price Below,
- MSFG Trend: Down.
YSFG Year 2026
- Long-Term
- YSFG Current: -38%
- F0%/NTZ' Bias: Price Below,
- YSFG Trend: Down.
Swing Pivots
- (Short-Term) 1. Pvt. Trend: DTrend,
- (Intermediate-Term) 2. HiLo Trend: DTrend,
- 3. Pvt. Evolve: Pvt low 102.875,
- 4. Pvt. Next: Pvt high 107.68750,
- 5. Levels R: 231.90625, 211.46875, 167.28125, 151.4375, 151.06250,
- 6. Levels S: 102.875.
Weekly Benchmarks
- (Short-Term) 5 Day: 108.75 Down Trend,
- (Short-Term) 10 Day: 109.40825 Down Trend,
- (Intermediate-Term) 20 Day: 111.65625 Down Trend,
- (Intermediate-Term) 55 Day: 114.375 Down Trend,
- (Long-Term) 100 Day: 116.53125 Down Trend,
- (Long-Term) 200 Day: 124.375 Down Trend.
Recent Trade Signals
- 01 Oct 2026: Short UB 12-26 @ 103 Signals.USAR-MSFG
- 28 Sep 2026: Short UB 12-26 @ 105.3125 Signals.USAR-WSFG
- 23 Sep 2026: Short UB 12-26 @ 107.78125 Signals.USAR.TR120
Overall Rating
- Short-Term: Bearish,
- Intermediate-Term: Bearish,
- Long-Term: Bearish.
Key Insights Summary
UB remains in a broad, synchronized decline: price is beneath every weekly benchmark, the weekly, monthly, and yearly Fib grids are all below their F0% reference, and both pivot-trend measures remain DTrend. The latest decline has accelerated into the 102.875 evolving pivot low, producing large weekly bars and fast downside momentum. The pivot sequence continues to show lower highs and lower lows; 107.68750 is the next pivot-reversal threshold, while the stacked moving averages from 108.75 through 124.375 define a deeply negative trend structure.
Chart Analysis ATS AI Generated: 2026-10-01 07:12 for Informational use only, not trading advice. Terms and Risk Disclosure Copyright © 2026. Algo Trading Systems LLC.