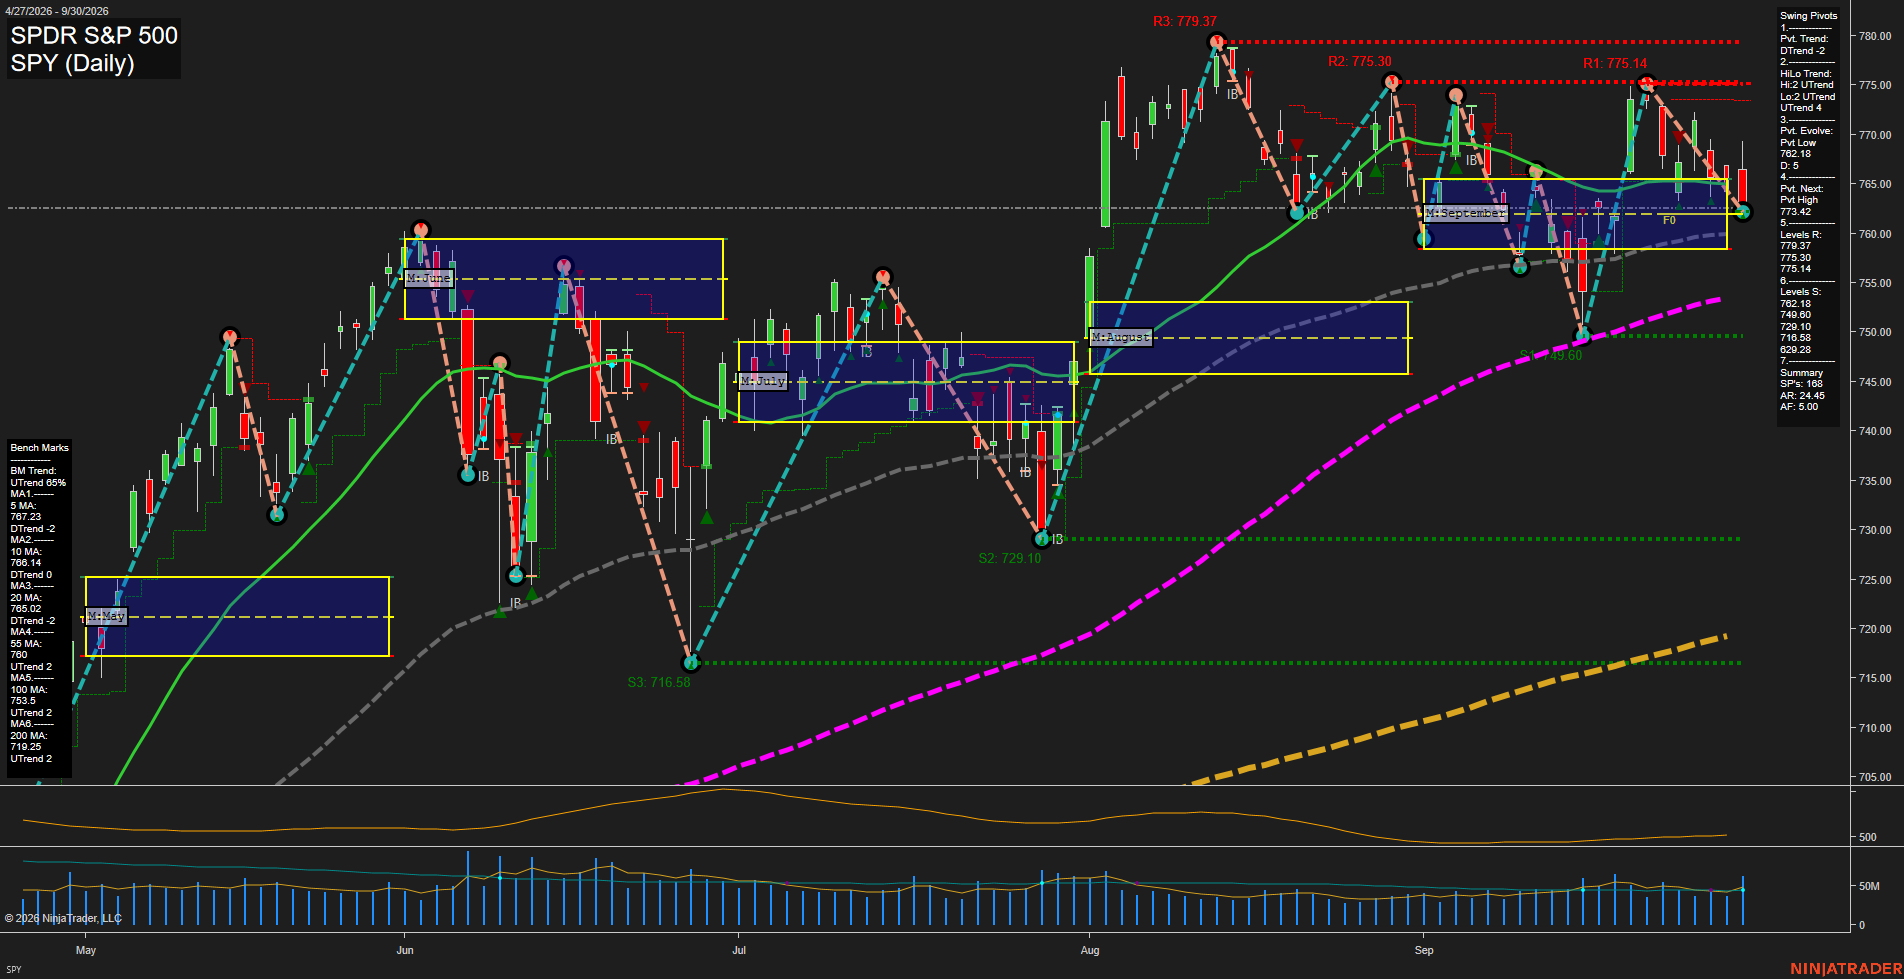
SPY SPDR S&P 500 Daily Chart Analysis: 2026-Oct-01 07:11 CT
Price Action
- Last: 762.18,
- Bars: Medium,
- Mom: Slow.
WSFG Weekly
- Short-Term
- WSFG Current: NA%
- F0%/NTZ' Bias: Price Neutral,
- WSFG Trend: Neutral.
MSFG Month Oct
- Intermediate-Term
- MSFG Current: NA%
- F0%/NTZ' Bias: Price Neutral,
- MSFG Trend: Neutral.
YSFG Year 2026
- Long-Term
- YSFG Current: NA%
- F0%/NTZ' Bias: Price Neutral,
- YSFG Trend: Neutral.
Swing Pivots
- (Short-Term) 1. Pvt. Trend: DTrend,
- (Intermediate-Term) 2. HiLo Trend: UTrend,
- 3. Pvt. Evolve: Pvt low 762.18,
- 4. Pvt. Next: Pvt high 773.42,
- 5. Levels R: 779.37, 775.30, 775.14,
- 6. Levels S: 762.18, 749.60, 729.10, 716.58, 629.28.
Daily Benchmarks
- (Short-Term) 5 Day: 767.23 Up Trend,
- (Short-Term) 10 Day: 766.14 Down Trend,
- (Intermediate-Term) 20 Day: 765.00 Down Trend,
- (Intermediate-Term) 55 Day: 760.00 Up Trend,
- (Long-Term) 100 Day: 753.54 Up Trend,
- (Long-Term) 200 Day: 719.25 Up Trend.
Additional Metrics
- ATR: 24.45,
- VOLMA: 29,000,000.
Overall Rating
- Short-Term: Bearish,
- Intermediate-Term: Bullish,
- Long-Term: Bullish.
Key Insights Summary
SPY is compressing near 762.18 after a rejection from the 775 area, leaving the short-term pivot structure in DTrend while price tests the rising 55-day benchmark. For futures swing context, the near-term auction is defined by 762.18 support versus the 773.42 pivot-reversal level, with clustered overhead resistance at 775.14 to 779.37. The intermediate and long-term structure remains constructive because the HiLo trend is positive and price remains above rising 55-, 100-, and 200-day benchmarks. The mixed 5-, 10-, and 20-day averages reflect a slowing, choppy pullback within the broader uptrend rather than a confirmed long-term trend reversal.
Chart Analysis ATS AI Generated: 2026-10-01 07:11 for Informational use only, not trading advice. Terms and Risk Disclosure Copyright © 2026. Algo Trading Systems LLC.