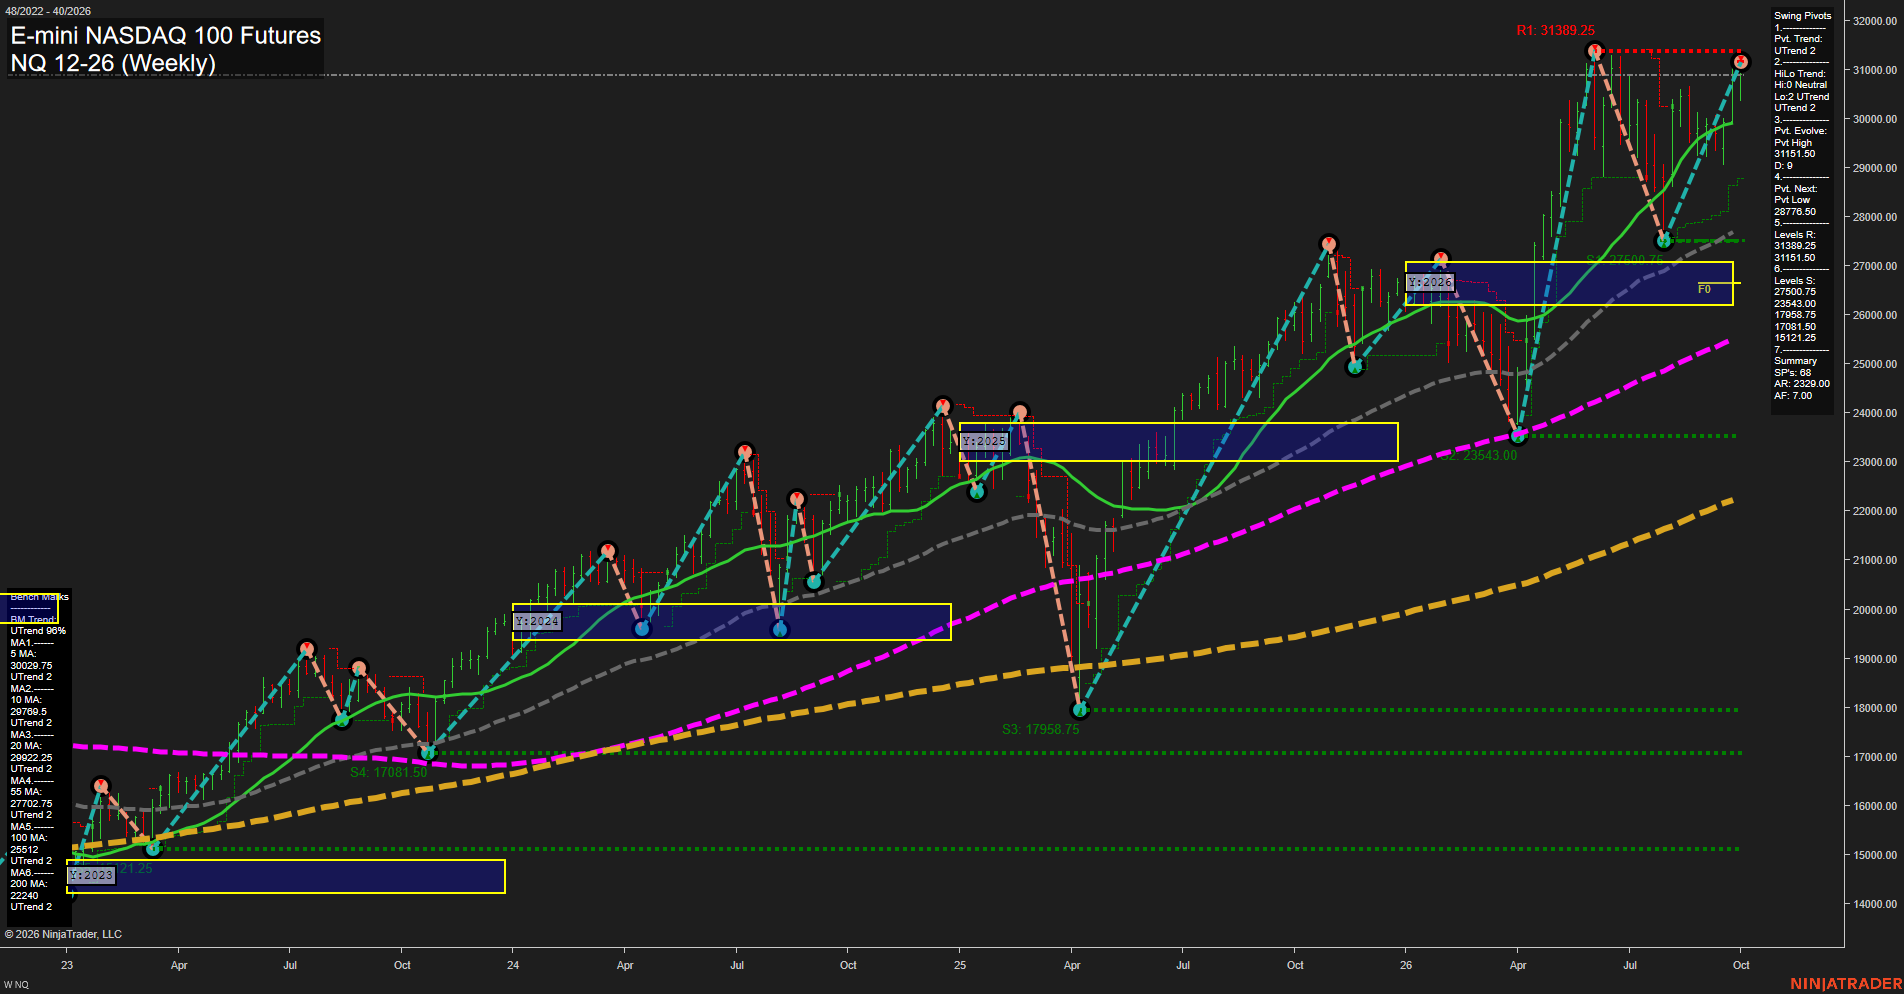
NQ E-mini NASDAQ 100 Futures Weekly Chart Analysis: 2026-Oct-01 07:08 CT
Price Action
- Last: 31151.50,
- Bars: Medium,
- Mom: Fast.
WSFG Weekly
- Short-Term
- WSFG Current: 1%
- F0%/NTZ' Bias: Price Above,
- WSFG Trend: Up.
MSFG Month Oct
- Intermediate-Term
- MSFG Current: -2%
- F0%/NTZ' Bias: Price Below,
- MSFG Trend: Down.
YSFG Year 2026
- Long-Term
- YSFG Current: 96%
- F0%/NTZ' Bias: Price Above,
- YSFG Trend: Up.
Swing Pivots
- (Short-Term) 1. Pvt. Trend: UTrend,
- (Intermediate-Term) 2. HiLo Trend: UTrend,
- 3. Pvt. Evolve: Pvt high 31151.50,
- 4. Pvt. Next: Pvt low 28776.50,
- 5. Levels R: 31389.25, 31151.50,
- 6. Levels S: 27500.75, 23543.00, 17958.75, 17081.50, 15121.25.
Weekly Benchmarks
- (Short-Term) 5 Day: 30389.75 Up Trend,
- (Short-Term) 10 Day: 29769.50 Up Trend,
- (Intermediate-Term) 20 Day: 29922.25 Up Trend,
- (Intermediate-Term) 55 Day: 27702.75 Up Trend,
- (Long-Term) 100 Day: 25512.00 Up Trend,
- (Long-Term) 200 Day: 22240.00 Up Trend.
Recent Trade Signals
- 01 Oct 2026: Long NQ 12-26 @ 30984.5 Signals.USAR-WSFG
- 30 Sep 2026: Long NQ 12-26 @ 30878.75 Signals.USAR.TR120
Overall Rating
- Short-Term: Bullish,
- Intermediate-Term: Neutral,
- Long-Term: Bullish.
Key Insights Summary
Weekly structure remains broadly constructive, with price above every benchmark average and the short-term pivot sequence holding an UTrend. Price is consolidating immediately beneath the 31151.50 to 31389.25 resistance band following a sharp recovery from the July pivot low, creating a high-level, volatile range rather than a clean weekly breakout. The weekly grid is positive and the yearly grid remains strongly positive, while the October monthly grid is marginally negative, describing an intermediate countertrend pause within the larger advance. The 28776.50 pivot-next level defines the major short-term reversal threshold, while the rising 20-week and 55-week benchmarks near 29922.25 and 27702.75 underline the broader higher-low structure.
Chart Analysis ATS AI Generated: 2026-10-01 07:08 for Informational use only, not trading advice. Terms and Risk Disclosure Copyright © 2026. Algo Trading Systems LLC.