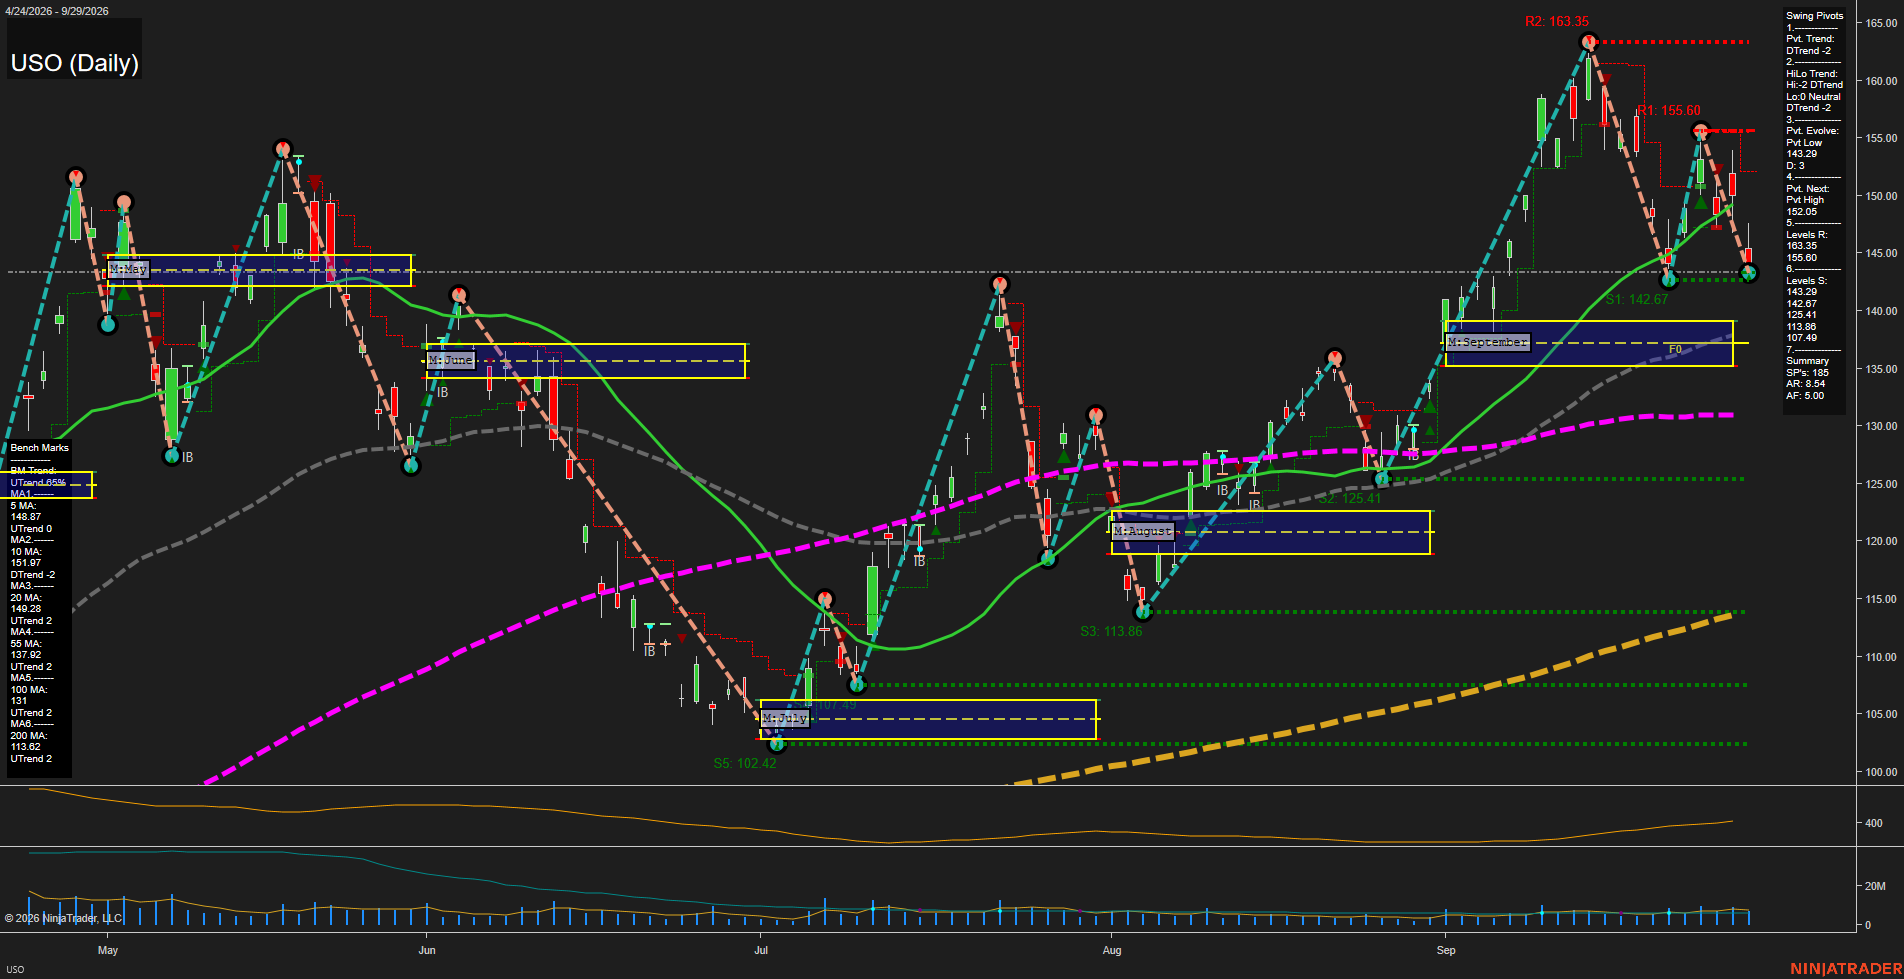
USO United States Oil Fund LP Daily Chart Analysis: 2026-Sep-30 07:12 CT
Price Action
- Last: 143.29,
- Bars: Medium,
- Mom: Average.
WSFG Weekly
- Short-Term
- WSFG Current: NA%
- F0%/NTZ' Bias: Price Neutral,
- WSFG Trend: Neutral.
MSFG Month Sep
- Intermediate-Term
- MSFG Current: 185%,
- F0%/NTZ' Bias: Price Bullish,
- MSFG Trend: UTrend.
YSFG Year 2026
- Long-Term
- YSFG Current: NA%
- F0%/NTZ' Bias: Price Neutral,
- YSFG Trend: Neutral.
Swing Pivots
- (Short-Term) 1. Pvt. Trend: DTrend,
- (Intermediate-Term) 2. HiLo Trend: DTrend,
- 3. Pvt. Evolve: Pvt low 143.29,
- 4. Pvt. Next: Pvt high 152.05,
- 5. Levels R: 163.35, 155.60, 152.05,
- 6. Levels S: 143.29, 142.67.
Daily Benchmarks
- (Short-Term) 5 Day: 148.37 Up Trend,
- (Short-Term) 10 Day: 151.97 Down Trend,
- (Intermediate-Term) 20 Day: 149.98 Up Trend,
- (Intermediate-Term) 55 Day: 137.92 Up Trend,
- (Long-Term) 100 Day: 131.31 Up Trend,
- (Long-Term) 200 Day: 113.62 Up Trend.
Additional Metrics
- ATR: 420,
- VOLMA: 2577640.
Overall Rating
- Short-Term: Bearish,
- Intermediate-Term: Bullish,
- Long-Term: Bullish.
Key Insights Summary
USO remains in a broad bullish structure above its rising 20, 55, 100, and 200 day benchmarks, but the immediate swing condition is corrective. The short-term pivot and HiLo trends are both DTrend following rejection from 163.35 and subsequent failure below the 152.05 pivot-high reversal level. Price is testing the 143.29 to 142.67 support cluster after a sharp retracement, while the September MSFG remains bullish because price is still above the monthly NTZ. The current pattern reflects a pullback within the larger advance, with 152.05, 155.60, and 163.35 defining overhead swing resistance and 142.67 serving as the near-term structural support reference.
Chart Analysis ATS AI Generated: 2026-09-30 07:13 for Informational use only, not trading advice. Terms and Risk Disclosure Copyright © 2026. Algo Trading Systems LLC.