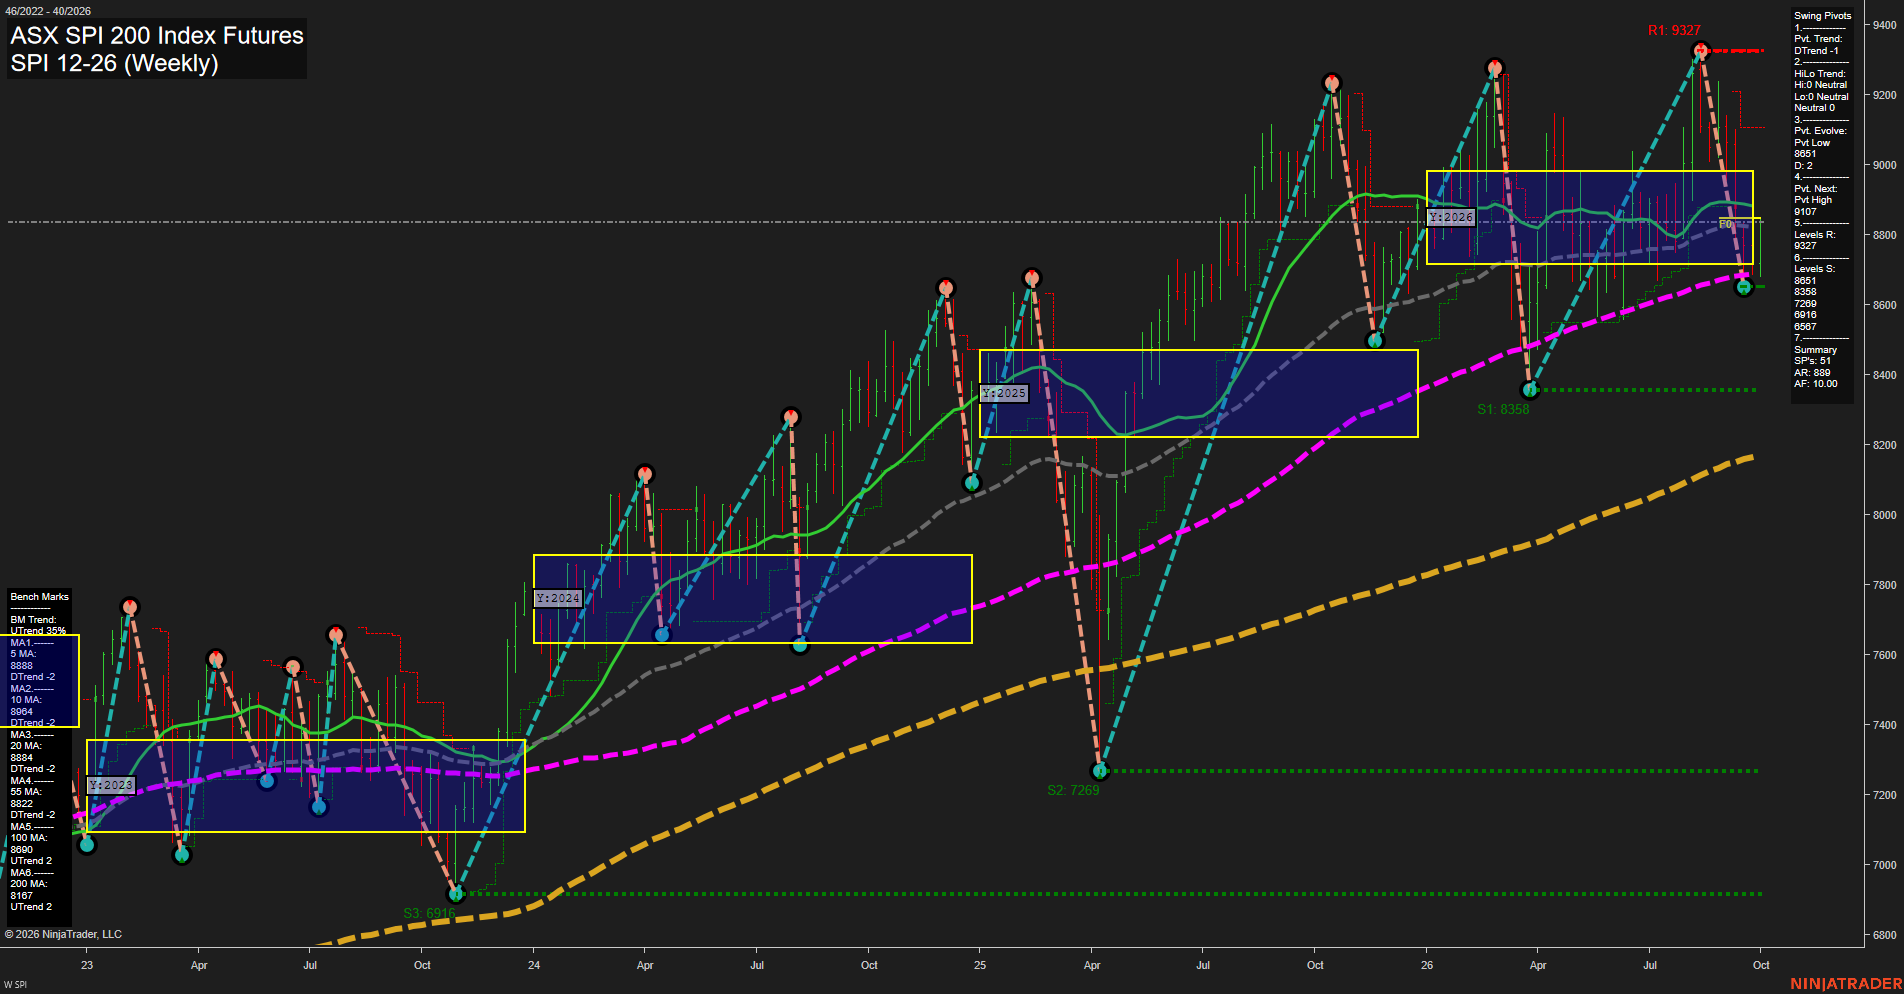
SPI ASX SPI 200 Index Futures Weekly Chart Analysis: 2026-Sep-30 07:11 CT
Price Action
- Last: 8831,
- Bars: Large,
- Mom: fast.
WSFG Weekly
- Short-Term
- WSFG Current: NA%
- F0%/NTZ' Bias: Price Neutral,
- WSFG Trend: Neutral.
MSFG Month Sep
- Intermediate-Term
- MSFG Current: NA%
- F0%/NTZ' Bias: Price Neutral,
- MSFG Trend: Neutral.
YSFG Year 2026
- Long-Term
- YSFG Current: NA%
- F0%/NTZ' Bias: Price Neutral,
- YSFG Trend: Neutral.
Swing Pivots
- (Short-Term) 1. Pvt. Trend: DTrend,
- (Intermediate-Term) 2. HiLo Trend: Neutral,
- 3. Pvt. Evolve: Pvt low 8651,
- 4. Pvt. Next: Pvt high 9107,
- 5. Levels R: 9327,
- 6. Levels S: 8651, 8358, 7269, 6916, 6567.
Weekly Benchmarks
- (Short-Term) 5 Day: 8831 Down Trend,
- (Short-Term) 10 Day: 8964 Down Trend,
- (Intermediate-Term) 20 Day: 8884 Down Trend,
- (Intermediate-Term) 55 Day: 8822 Down Trend,
- (Long-Term) 100 Day: 8690 Up Trend,
- (Long-Term) 200 Day: 8167 Up Trend.
Overall Rating
- Short-Term: Bearish,
- Intermediate-Term: Neutral,
- Long-Term: Bullish.
Key Insights Summary
SPI futures have undergone a sharp weekly reversal from the 9327 swing-high area, producing large-range downside price action and a fast bearish short-term momentum phase. Price is below the 10 and 20 period benchmarks and has tested the 55 period average near 8822, while the active pivot structure remains in DTrend with 9107 identified as the next opposing pivot threshold. The intermediate pivot structure is neutral rather than decisively bearish, reflecting the broader consolidation between 8651 support and 9327 resistance. Long-term structure remains constructive because price is above rising 100 and 200 period benchmarks, although the current decline is a meaningful counter-trend retracement within that larger uptrend.
Chart Analysis ATS AI Generated: 2026-09-30 07:12 for Informational use only, not trading advice. Terms and Risk Disclosure Copyright © 2026. Algo Trading Systems LLC.