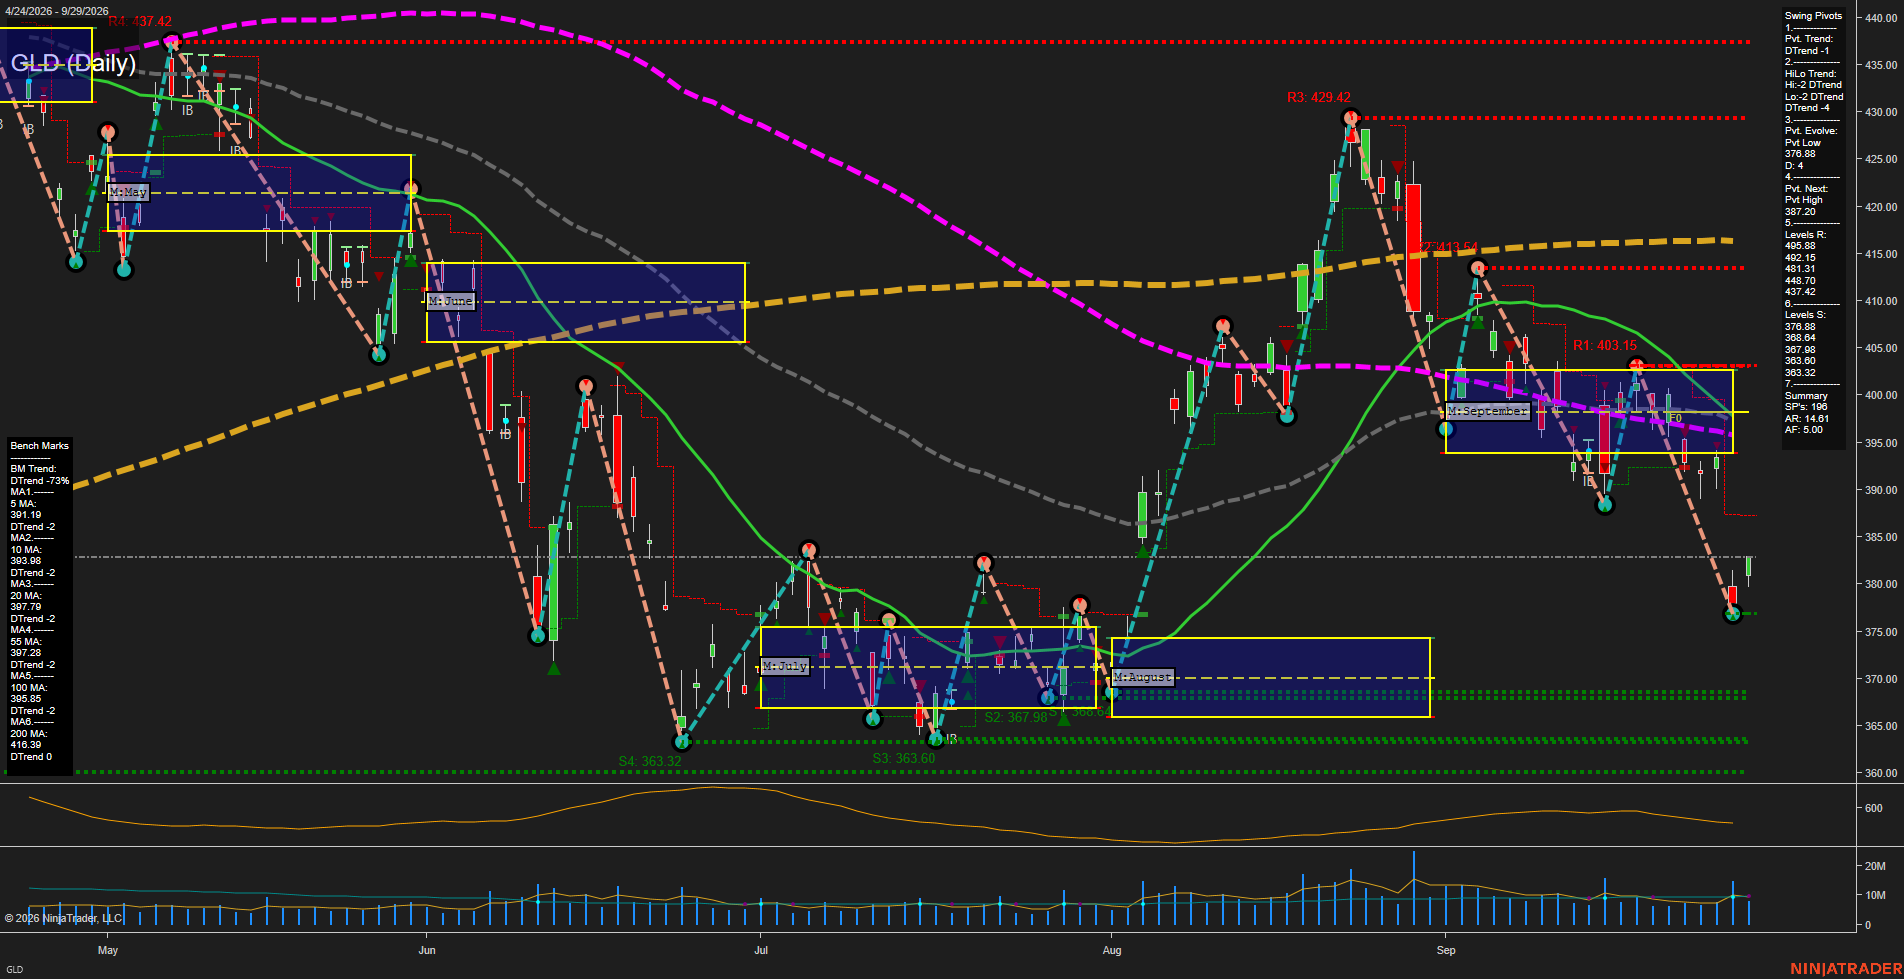
GLD SPDR Gold Shares Daily Chart Analysis: 2026-Sep-30 07:06 CT
Price Action
- Last: 382.00,
- Bars: Medium,
- Mom: Fast.
WSFG Weekly
- Short-Term
- WSFG Current: NA%
- F0%/NTZ' Bias: Price Bearish,
- WSFG Trend: Bearish.
MSFG Month Sep
- Intermediate-Term
- MSFG Current: NA%
- F0%/NTZ' Bias: Price Bearish,
- MSFG Trend: Bearish.
YSFG Year 2026
- Long-Term
- YSFG Current: NA%
- F0%/NTZ' Bias: Price Bearish,
- YSFG Trend: Bearish.
Swing Pivots
- (Short-Term) 1. Pvt. Trend: DTrend,
- (Intermediate-Term) 2. HiLo Trend: DTrend,
- 3. Pvt. Evolve: Pvt low 376.88,
- 4. Pvt. Next: Pvt high 387.20,
- 5. Levels R: 495.88, 492.15, 481.31, 448.70, 437.42,
- 6. Levels S: 376.88, 368.64, 367.98, 363.60, 363.32.
Daily Benchmarks
- (Short-Term) 5 Day: 391.19 Down Trend,
- (Short-Term) 10 Day: 393.98 Down Trend,
- (Intermediate-Term) 20 Day: 397.79 Down Trend,
- (Intermediate-Term) 55 Day: 397.28 Down Trend,
- (Long-Term) 100 Day: 395.55 Down Trend,
- (Long-Term) 200 Day: 416.39 Down Trend.
Additional Metrics
- ATR: 5.01,
- VOLMA: 7207880.
Overall Rating
- Short-Term: Bearish,
- Intermediate-Term: Bearish,
- Long-Term: Bearish.
Key Insights Summary
GLD, as a liquid proxy for gold-futures directional conditions, remains in a broad bearish swing structure. The latest rebound from the 376.88 pivot low is a counter-trend bounce following a sharp decline, while price remains beneath every tracked daily benchmark. The pivot sequence remains lower-high/lower-low oriented, with 387.20 defining the next opposing pivot threshold and clustered moving-average resistance near 391.19 to 397.79. The September monthly grid has been decisively lost on the downside, leaving 376.88 as the immediate swing reference and 368.64 to 363.32 as the lower support band. Volatility remains elevated relative to the recent consolidation, consistent with fast downside momentum and wider daily futures-equivalent price swings.
Chart Analysis ATS AI Generated: 2026-09-30 07:06 for Informational use only, not trading advice. Terms and Risk Disclosure Copyright © 2026. Algo Trading Systems LLC.