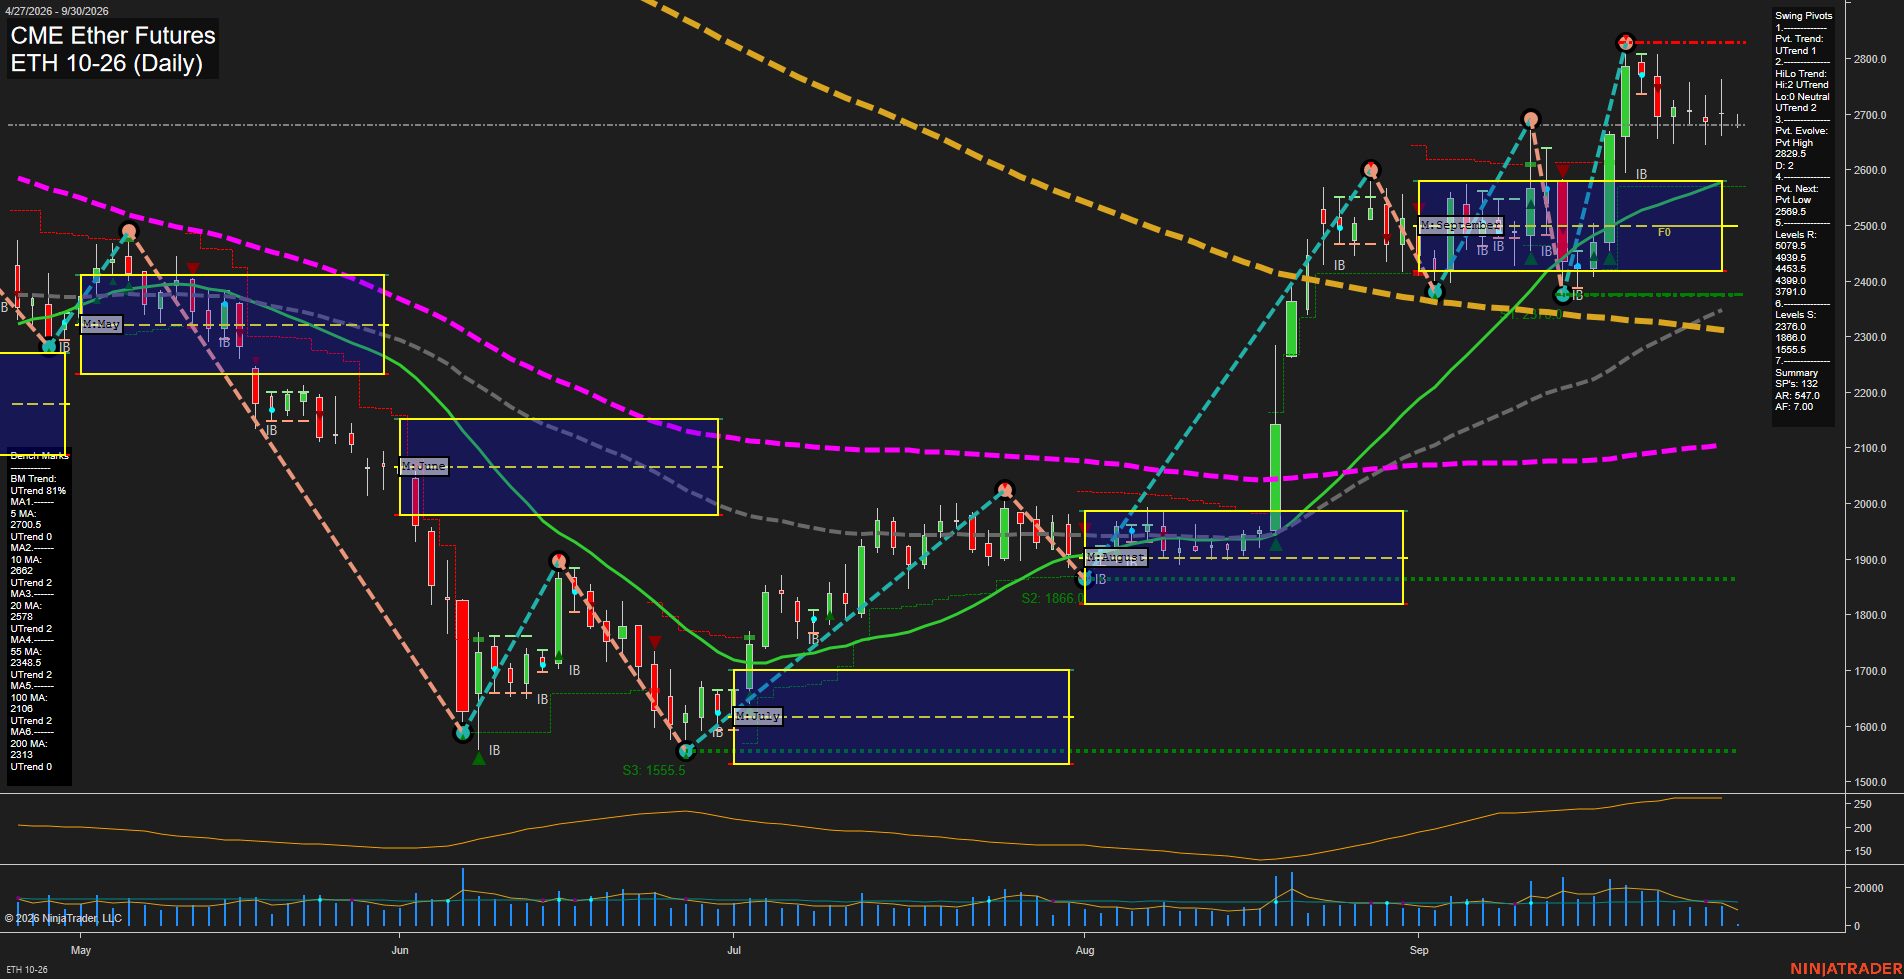
ETH CME Ether Futures Daily Chart Analysis: 2026-Sep-30 07:04 CT
Price Action
- Last: 2688.0,
- Bars: Small,
- Mom: Slow.
WSFG Weekly
- Short-Term
- WSFG Current: 0%
- F0%/NTZ' Bias: Price Neutral,
- WSFG Trend: Neutral.
MSFG Month Sep
- Intermediate-Term
- MSFG Current: 28%
- F0%/NTZ' Bias: Price Above,
- MSFG Trend: Up.
YSFG Year 2026
- Long-Term
- YSFG Current: -13%
- F0%/NTZ' Bias: Price Below,
- YSFG Trend: Down.
Swing Pivots
- (Short-Term) 1. Pvt. Trend: UTrend,
- (Intermediate-Term) 2. HiLo Trend: UTrend,
- 3. Pvt. Evolve: Pvt high 2829.5,
- 4. Pvt. Next: Pvt low 2596.5,
- 5. Levels R: 5079.5, 4939.5, 4543.5, 4391.0,
- 6. Levels S: 2376.0, 1866.0, 1555.5.
Daily Benchmarks
- (Short-Term) 5 Day: 2700.5 Up Trend,
- (Short-Term) 10 Day: 2662.0 Up Trend,
- (Intermediate-Term) 20 Day: 2578.0 Up Trend,
- (Intermediate-Term) 55 Day: 2348.0 Up Trend,
- (Long-Term) 100 Day: 2106.0 Up Trend,
- (Long-Term) 200 Day: 2313.0 Up Trend.
Additional Metrics
Recent Trade Signals
- 30 Sep 2026: Short ETH 10-26 @ 2679.5 Signals.USAR-WSFG
- 23 Sep 2026: Short ETH 09-26 @ 2668.5 Signals.USAR.TR120
Overall Rating
- Short-Term: Bullish,
- Intermediate-Term: Bullish,
- Long-Term: Neutral.
Key Insights Summary
ETH futures retain a constructive swing structure, with both pivot trend measures rising and price holding above the 10-, 20-, 55-, and 100-day benchmarks. The recent advance stalled beneath the 2829.5 pivot high, producing small, consolidating daily bars near 2700 and slower momentum after the September rally. Price remains above the September MSFG NTZ and F0% area, supporting the intermediate uptrend, while the weekly grid is neutral and the annual grid remains below its F0% reference. The chart reflects a bullish intermediate recovery within a still-unresolved longer-term yearly retracement.
Chart Analysis ATS AI Generated: 2026-09-30 07:04 for Informational use only, not trading advice. Terms and Risk Disclosure Copyright © 2026. Algo Trading Systems LLC.