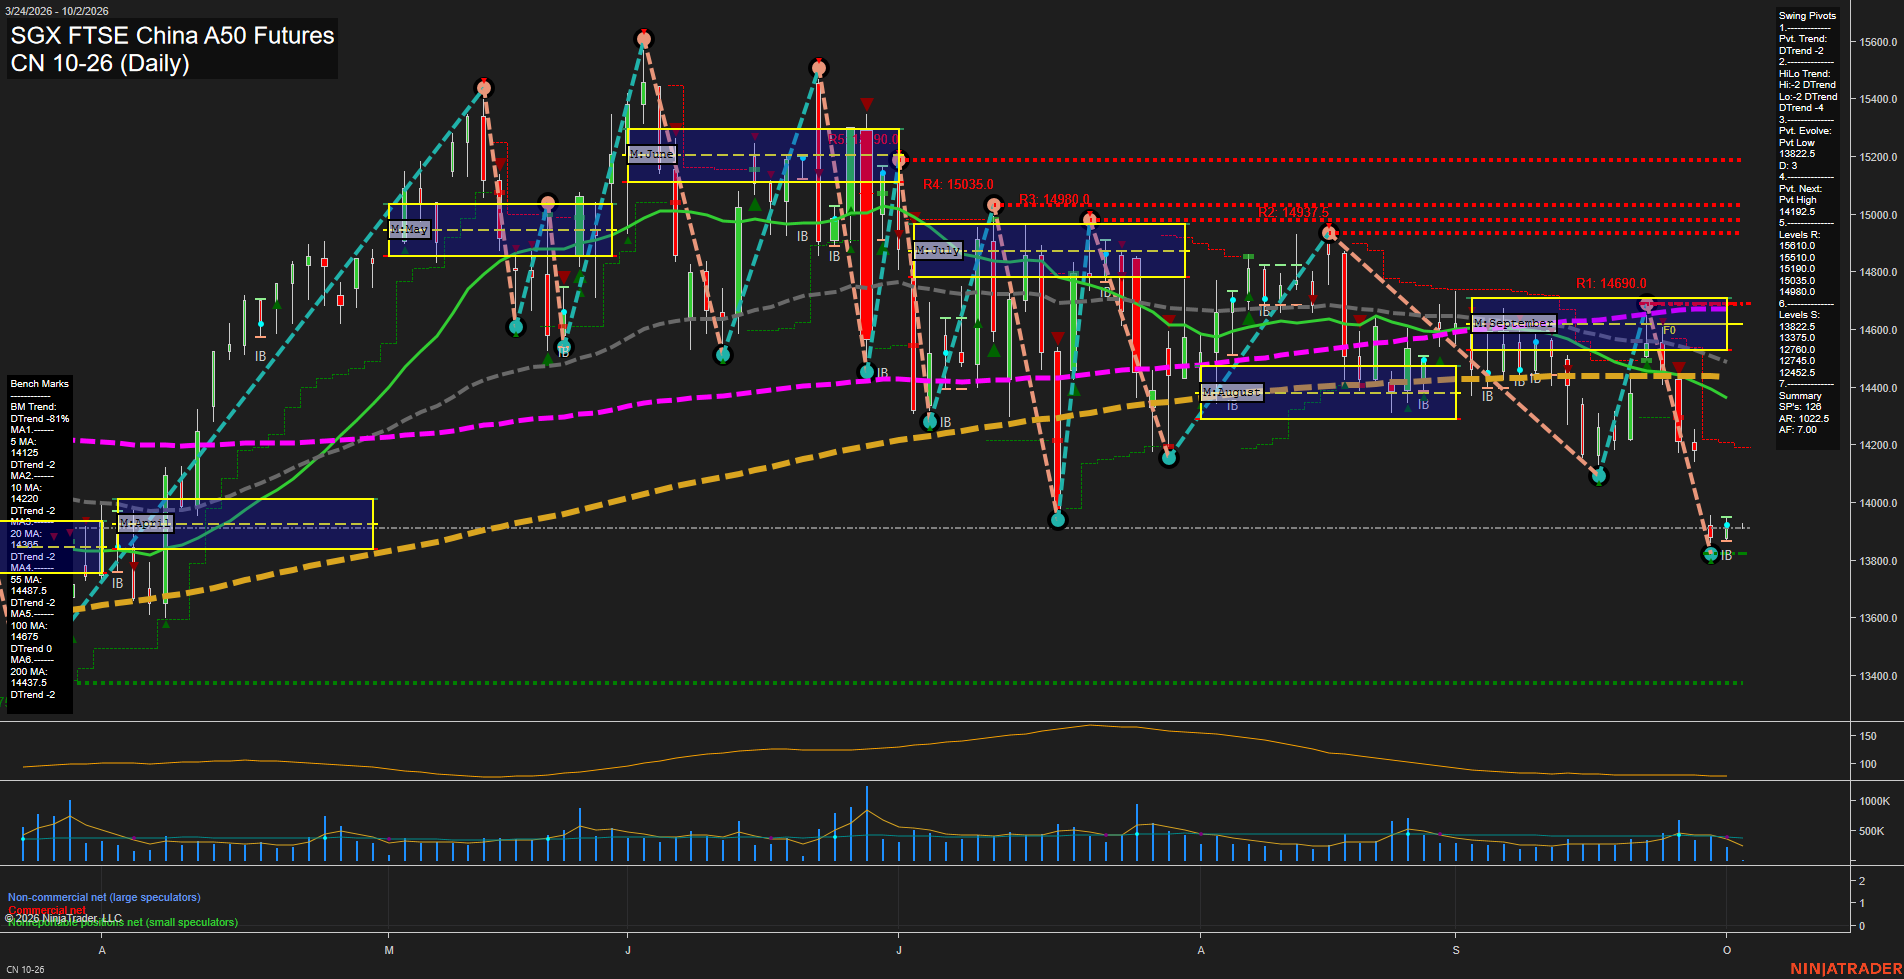
CN SGX FTSE China A50 Futures Daily Chart Analysis: 2026-Sep-30 07:02 CT
Price Action
- Last: 13926,
- Bars: Medium,
- Mom: Fast.
WSFG Weekly
- Short-Term
- WSFG Current: NA%
- F0%/NTZ' Bias: Price Bearish,
- WSFG Trend: DTrend.
MSFG Month Sep
- Intermediate-Term
- MSFG Current: NA%
- F0%/NTZ' Bias: Price Below NTZ,
- MSFG Trend: DTrend.
YSFG Year 2026
- Long-Term
- YSFG Current: NA%
- F0%/NTZ' Bias: Price Bearish,
- YSFG Trend: DTrend.
Swing Pivots
- (Short-Term) 1. Pvt. Trend: DTrend,
- (Intermediate-Term) 2. HiLo Trend: DTrend,
- 3. Pvt. Evolve: Pvt low 13822.5,
- 4. Pvt. Next: Pvt high 14192.5,
- 5. Levels R: 15610.0, 15510.0, 15190.0, 15035.0, 14980.0,
- 6. Levels S: 13822.5, 13375.0, 12760.0, 12745.0, 12452.5.
Daily Benchmarks
- (Short-Term) 5 Day: 14125 Down Trend,
- (Short-Term) 10 Day: 14220 Down Trend,
- (Intermediate-Term) 20 Day: 14290 Down Trend,
- (Intermediate-Term) 55 Day: 14487.5 Down Trend,
- (Long-Term) 100 Day: 14675 Down Trend,
- (Long-Term) 200 Day: 14373.5 Down Trend.
Additional Metrics
- ATR: 102.5,
- VOLMA: 261842.
Overall Rating
- Short-Term: Bearish,
- Intermediate-Term: Bearish,
- Long-Term: Bearish.
Key Insights Summary
Price is in a sharp lower-leg continuation, trading beneath every daily benchmark and below the September monthly NTZ. Both pivot structures remain in DTrend, with the latest 13822.5 pivot low defining nearby support and 14192.5 the first pivot reversal level. The recent decline has expanded momentum while ATR remains elevated, and the small rebound from the low currently reads as a counter-trend bounce beneath the 5-, 10-, and 20-day averages. The benchmark stack is broadly bearish, with 14373.5 to 14675 marking a dense longer-term overhead resistance zone.
Chart Analysis ATS AI Generated: 2026-09-30 07:03 for Informational use only, not trading advice. Terms and Risk Disclosure Copyright © 2026. Algo Trading Systems LLC.