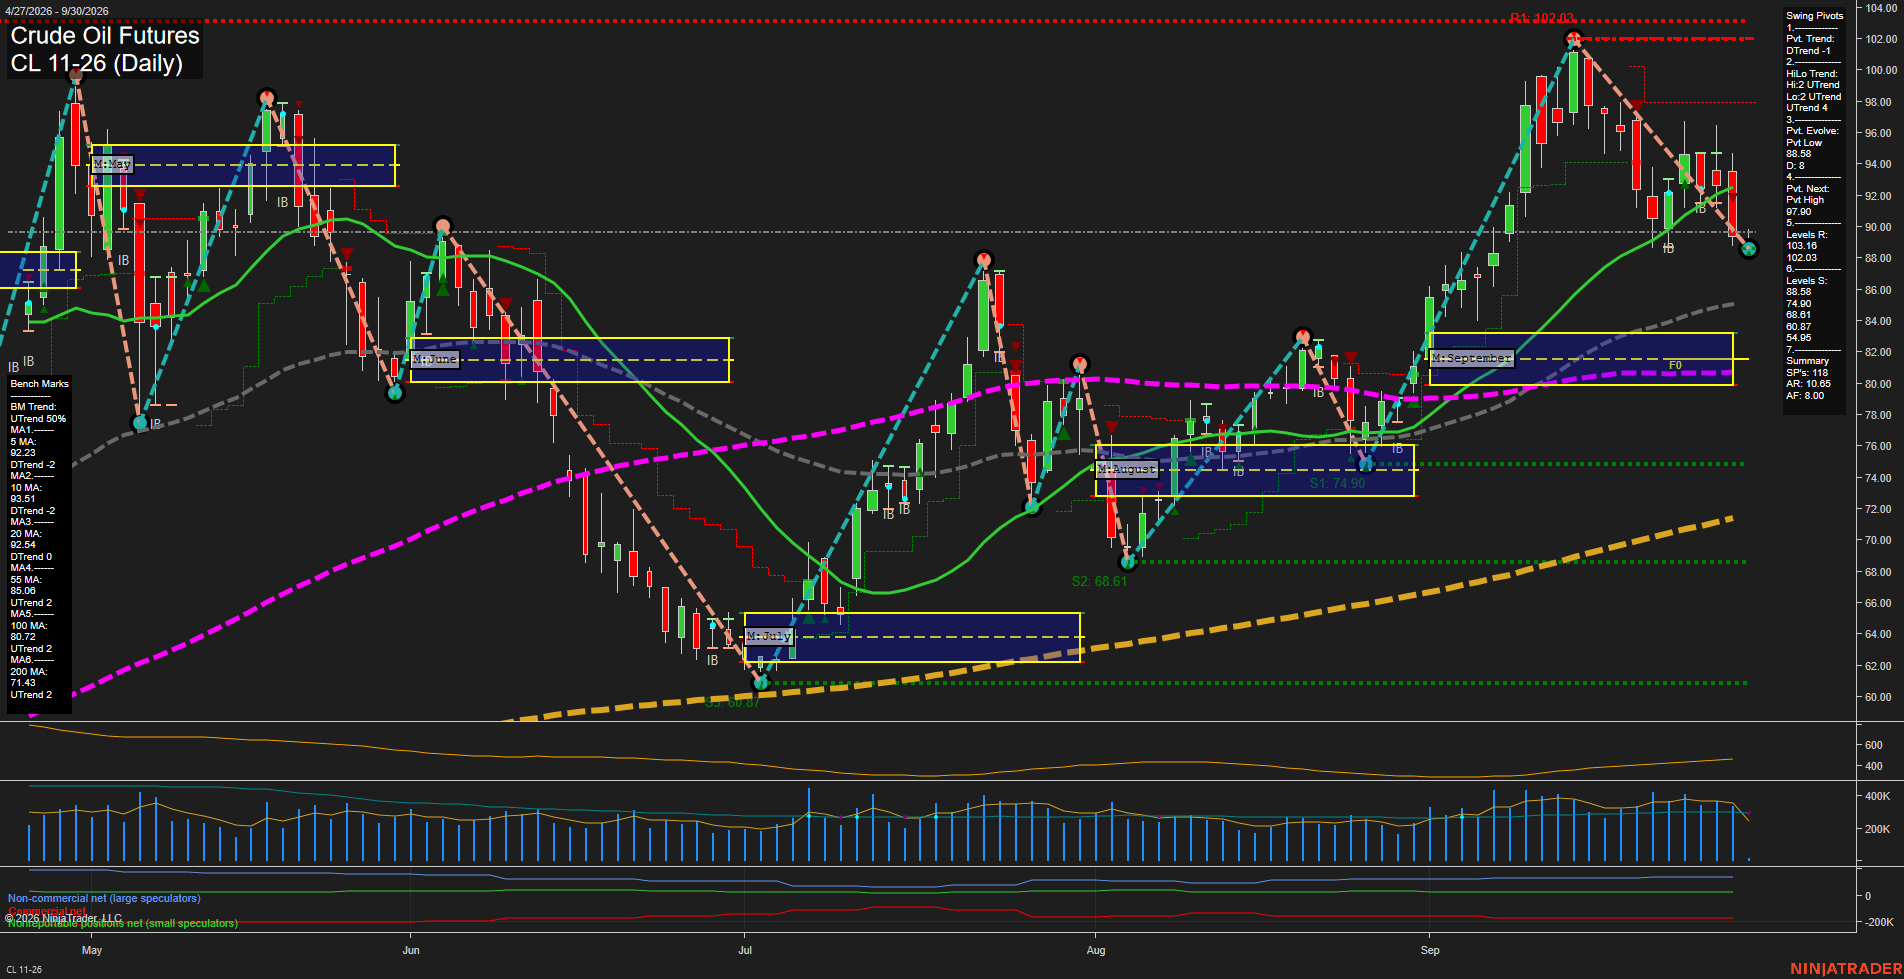
CL Crude Oil Futures Daily Chart Analysis: 2026-Sep-30 07:02 CT
Price Action
- Last: 88.58,
- Bars: Medium,
- Mom: fast.
WSFG Weekly
- Short-Term
- WSFG Current: -31%
- F0%/NTZ' Bias: Price Below,
- WSFG Trend: Down.
MSFG Month Sep
- Intermediate-Term
- MSFG Current: 37%
- F0%/NTZ' Bias: Price Above,
- MSFG Trend: Up.
YSFG Year 2026
- Long-Term
- YSFG Current: 151%
- F0%/NTZ' Bias: Price Above,
- YSFG Trend: Up.
Swing Pivots
- (Short-Term) 1. Pvt. Trend: DTrend,
- (Intermediate-Term) 2. HiLo Trend: UTrend,
- 3. Pvt. Evolve: Pvt low 88.58,
- 4. Pvt. Next: Pvt high 97.90,
- 5. Levels R: 103.16, 102.03,
- 6. Levels S: 88.58, 74.90, 68.61, 60.87, 54.95.
Daily Benchmarks
- (Short-Term) 5 Day: 92.23 Down Trend,
- (Short-Term) 10 Day: 93.51 Down Trend,
- (Intermediate-Term) 20 Day: 92.54 Down Trend,
- (Intermediate-Term) 55 Day: 85.06 Up Trend,
- (Long-Term) 100 Day: 80.72 Up Trend,
- (Long-Term) 200 Day: 71.43 Up Trend.
Additional Metrics
Recent Trade Signals
- 29 Sep 2026: Short CL 11-26 @ 91.15 Signals.USAR.TR120
- 29 Sep 2026: Short CL 11-26 @ 92.49 Signals.USAR-WSFG
- 23 Sep 2026: Short CL 11-26 @ 89.36 Signals.USAR.TR720
Overall Rating
- Short-Term: Bearish,
- Intermediate-Term: Neutral,
- Long-Term: Bullish.
Key Insights Summary
Price has undergone a fast, medium-range pullback from the 102.03 swing-high area and has established a short-term DTrend with price below the 5, 10, and 20-day benchmarks. The weekly grid is negative and recent short signals align with the active decline. However, the intermediate HiLo structure remains upward and price holds above the rising 55, 100, and 200-day averages, characterizing the current action as a sharp countertrend retracement within a broader long-term advance. The 88.58 pivot low is the immediate structural reference, while 92.23 to 93.51 marks the nearby short-term moving-average congestion zone.
Chart Analysis ATS AI Generated: 2026-09-30 07:02 for Informational use only, not trading advice. Terms and Risk Disclosure Copyright © 2026. Algo Trading Systems LLC.