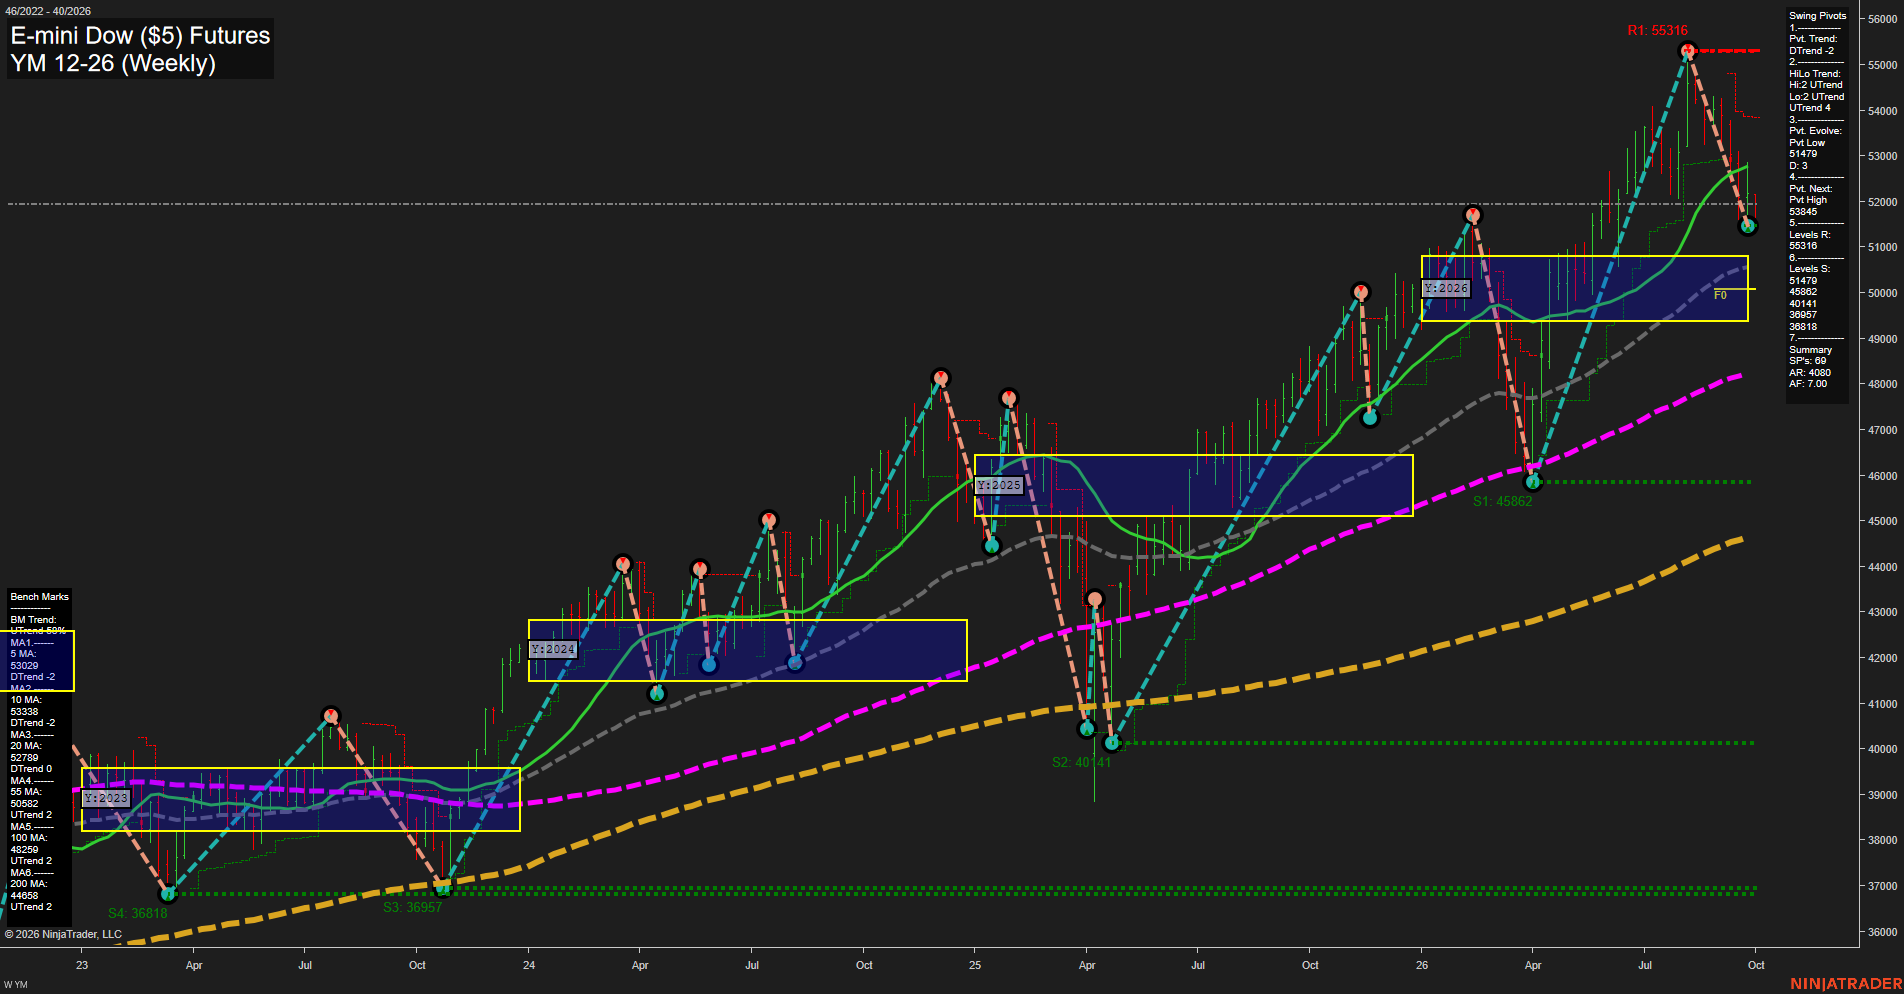
YM E-mini Dow ($5) Futures Weekly Chart Analysis: 2026-Sep-29 07:14 CT
Price Action
- Last: 51903,
- Bars: Medium,
- Mom: Slow.
WSFG Weekly
- Short-Term
- WSFG Current: -14%
- F0%/NTZ' Bias: Price Below,
- WSFG Trend: Down.
MSFG Month Sep
- Intermediate-Term
- MSFG Current: -74%
- F0%/NTZ' Bias: Price Below,
- MSFG Trend: Down.
YSFG Year 2026
- Long-Term
- YSFG Current: 26%
- F0%/NTZ' Bias: Price Above,
- YSFG Trend: Up.
Swing Pivots
- (Short-Term) 1. Pvt. Trend: DTrend,
- (Intermediate-Term) 2. HiLo Trend: UTrend,
- 3. Pvt. Evolve: Pvt low 51479,
- 4. Pvt. Next: Pvt high 53845,
- 5. Levels R: 55316,
- 6. Levels S: 51479, 45862, 40141, 36957, 36818.
Weekly Benchmarks
- (Short-Term) 5 Day: 53023 Down Trend,
- (Short-Term) 10 Day: 53338 Down Trend,
- (Intermediate-Term) 20 Day: 52788 Down Trend,
- (Intermediate-Term) 55 Day: 50582 Up Trend,
- (Long-Term) 100 Day: 48259 Up Trend,
- (Long-Term) 200 Day: 44650 Up Trend.
Recent Trade Signals
- 28 Sep 2026: Short YM 12-26 @ 51903 Signals.USAR-WSFG
- 25 Sep 2026: Long YM 12-26 @ 52124 Signals.USAR.TR120
Overall Rating
- Short-Term: Bearish,
- Intermediate-Term: Neutral,
- Long-Term: Bullish.
Key Insights Summary
Price is in a short-term downswing from the 55316 pivot high, with the latest decline establishing a 51479 pivot low and placing price below the weekly and monthly Fib-grid centers. The medium weekly bar structure and slow momentum indicate a measured retracement rather than an accelerating selloff. The intermediate structure remains mixed: the HiLo trend is still upward and price holds above the rising 55, 100, and 200 benchmarks, while the 20 benchmark and monthly grid remain negative. The broader yearly trend remains constructive above the yearly F0% level, making the current pattern a countertrend pullback within a longer-term advance unless the deeper support sequence begins to fail.
Chart Analysis ATS AI Generated: 2026-09-29 07:14 for Informational use only, not trading advice. Terms and Risk Disclosure Copyright © 2026. Algo Trading Systems LLC.