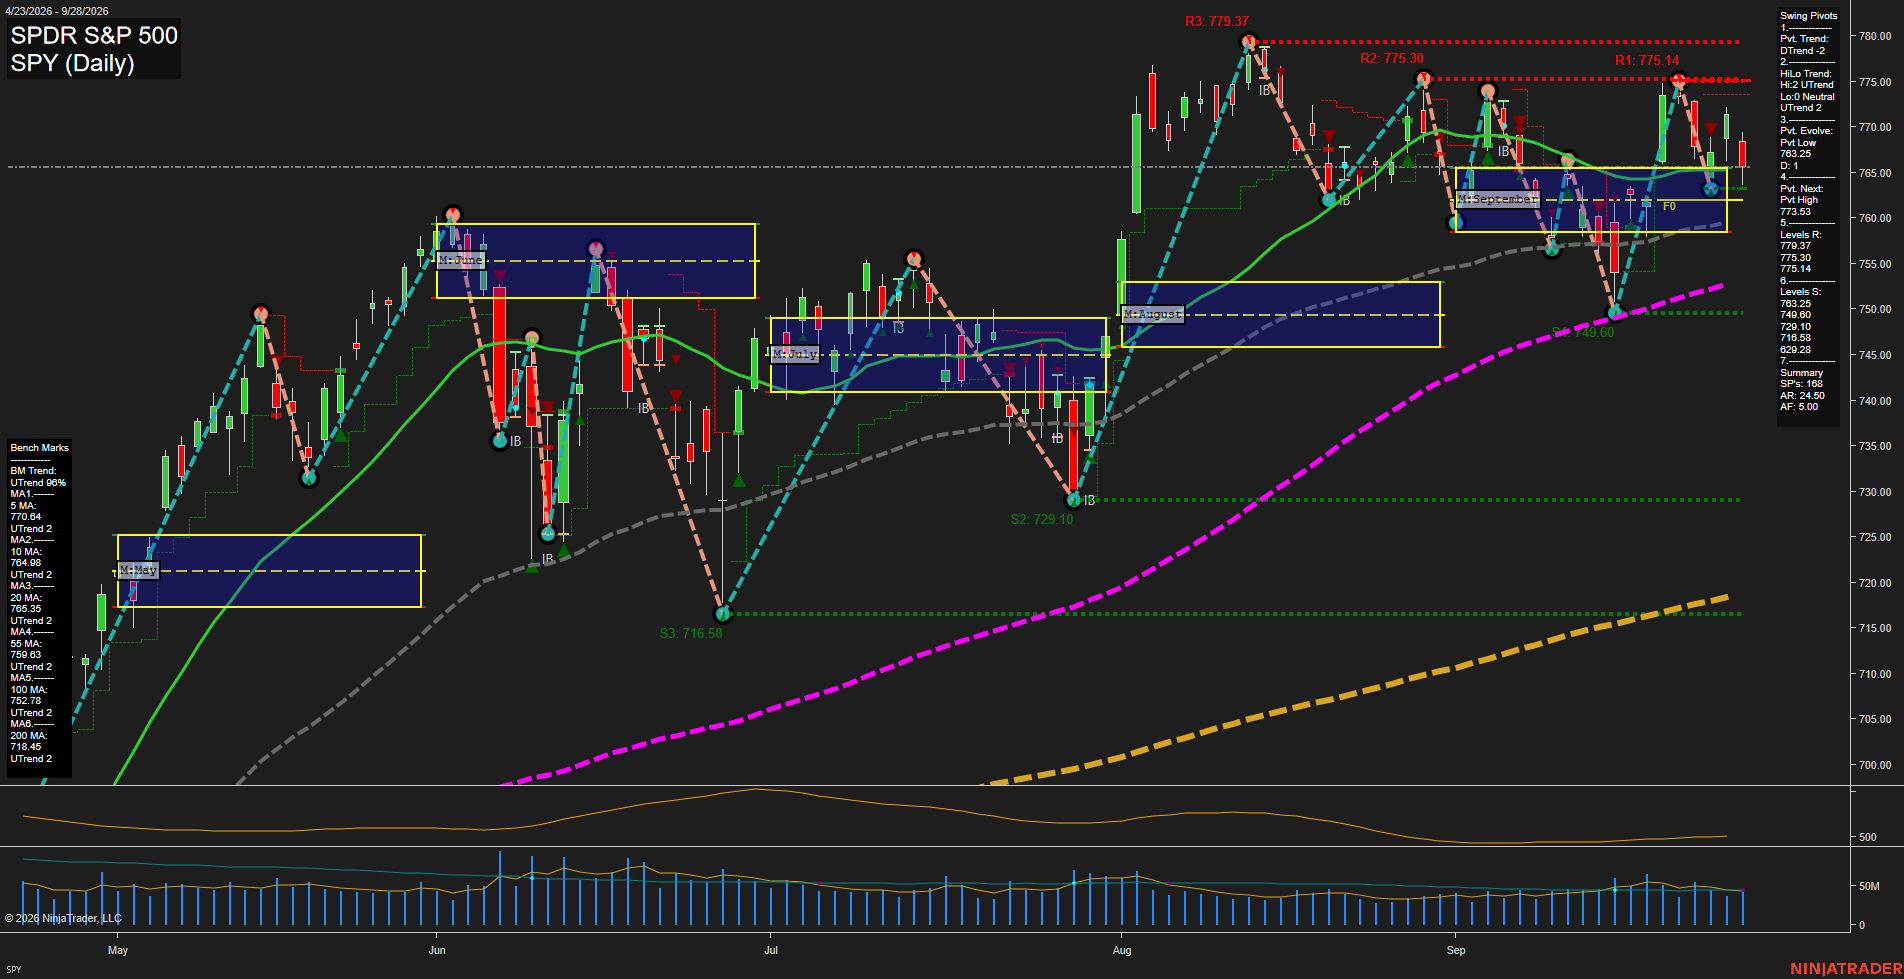
SPY SPDR S&P 500 Daily Chart Analysis: 2026-Sep-29 07:12 CT
Price Action
- Last: 765.25,
- Bars: Small,
- Mom: Slow.
WSFG Weekly
- Short-Term
- WSFG Current: NA%
- F0%/NTZ' Bias: Price Neutral,
- WSFG Trend: Neutral.
MSFG Month Sep
- Intermediate-Term
- MSFG Current: NA%
- F0%/NTZ' Bias: Price Bullish,
- MSFG Trend: Bullish.
YSFG Year 2026
- Long-Term
- YSFG Current: NA%
- F0%/NTZ' Bias: Price Neutral,
- YSFG Trend: Bullish.
Swing Pivots
- (Short-Term) 1. Pvt. Trend: DTrend,
- (Intermediate-Term) 2. HiLo Trend: UTrend,
- 3. Pvt. Evolve: Pvt low 763.25,
- 4. Pvt. Next: Pvt high 773.53,
- 5. Levels R: 779.37, 775.30, 775.14,
- 6. Levels S: 763.25, 749.60, 729.10, 716.58.
Daily Benchmarks
- (Short-Term) 5 Day: 770.64 Up Trend,
- (Short-Term) 10 Day: 764.98 Up Trend,
- (Intermediate-Term) 20 Day: 765.95 Up Trend,
- (Intermediate-Term) 55 Day: 759.63 Up Trend,
- (Long-Term) 100 Day: 752.78 Up Trend,
- (Long-Term) 200 Day: 718.45 Up Trend.
Additional Metrics
- ATR: 24.50,
- VOLMA: 47470907.
Overall Rating
- Short-Term: Neutral,
- Intermediate-Term: Bullish,
- Long-Term: Bullish.
Key Insights Summary
SPY futures swing structure remains broadly constructive above the rising 55-, 100-, and 200-day benchmarks, while the intermediate pivot sequence remains in an UTrend. Short-term rotation is softer: price is below the 5-day average, marginally below the 20-day average, and the active pivot trend is DTrend following rejection from the 775 area. The 763.25 pivot low is the immediate structural reference, with 775.14-775.30 and then 779.37 defining the overhead swing-high resistance band. Price is consolidating near the upper portion of the September monthly grid after a volatile advance, reflecting a bullish longer-cycle backdrop with choppy, mean-reverting near-term futures behavior.
Chart Analysis ATS AI Generated: 2026-09-29 07:12 for Informational use only, not trading advice. Terms and Risk Disclosure Copyright © 2026. Algo Trading Systems LLC.