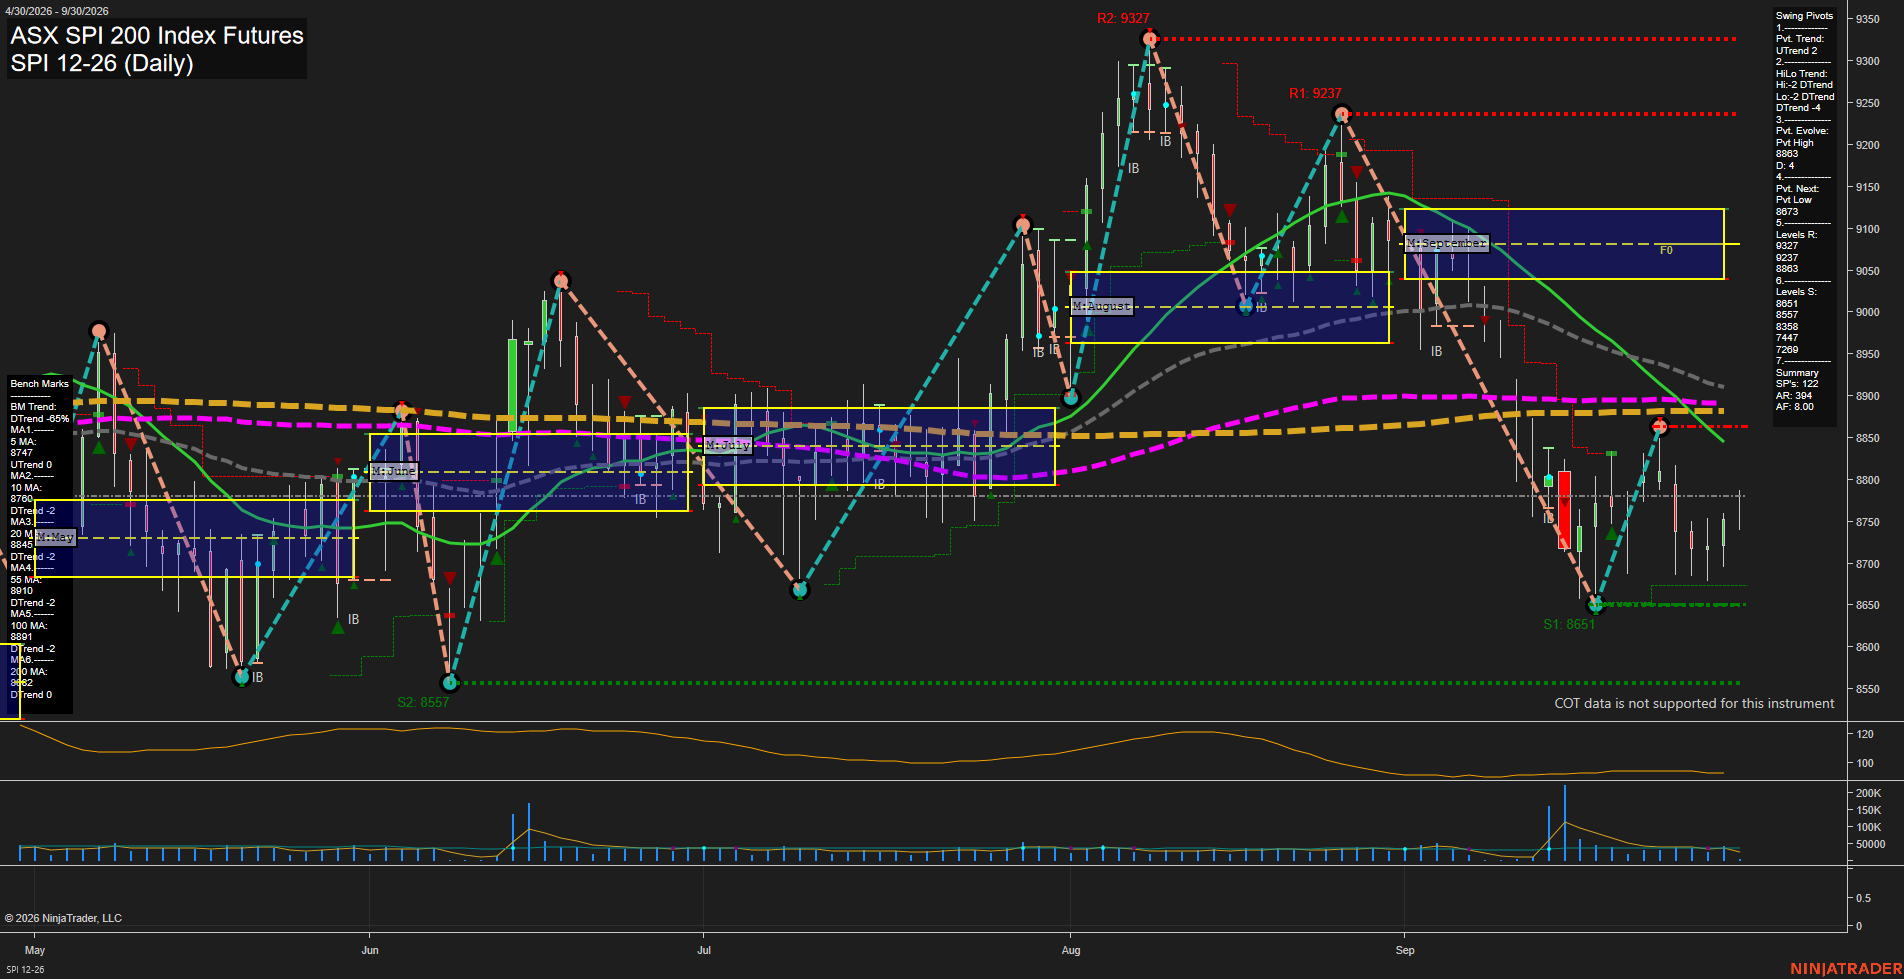
SPI ASX SPI 200 Index Futures Daily Chart Analysis: 2026-Sep-29 07:12 CT
Price Action
- Last: 8798,
- Bars: Small,
- Mom: slow.
WSFG Weekly
- Short-Term
- WSFG Current: NA%
- F0%/NTZ' Bias: Price Neutral,
- WSFG Trend: Neutral.
MSFG Month Sep
- Intermediate-Term
- MSFG Current: NA%
- F0%/NTZ' Bias: Price Bearish,
- MSFG Trend: Down.
YSFG Year 2026
- Long-Term
- YSFG Current: NA%
- F0%/NTZ' Bias: Price Neutral,
- YSFG Trend: Neutral.
Swing Pivots
- (Short-Term) 1. Pvt. Trend: UTrend,
- (Intermediate-Term) 2. HiLo Trend: DTrend,
- 3. Pvt. Evolve: Pvt high 8889,
- 4. Pvt. Next: Pvt low 8673,
- 5. Levels R: 9327, 9237, 8883,
- 6. Levels S: 8651, 8557, 8358, 7447.
Daily Benchmarks
- (Short-Term) 5 Day: 8747 Up Trend,
- (Short-Term) 10 Day: 8760 Down Trend,
- (Intermediate-Term) 20 Day: 8845 Down Trend,
- (Intermediate-Term) 55 Day: 8910 Down Trend,
- (Long-Term) 100 Day: 8891 Down Trend,
- (Long-Term) 200 Day: 8852 Down Trend.
Additional Metrics
Overall Rating
- Short-Term: Neutral,
- Intermediate-Term: Bearish,
- Long-Term: Bearish.
Key Insights Summary
SPI futures are attempting a short-term rebound from the 8651 swing-low support zone, with the pivot sequence currently marked UTrend. However, price remains beneath the declining 20-, 55-, 100-, and 200-day benchmarks and below the September MSFG lower area, preserving a broader intermediate and long-term bearish structure. The 8883 pivot resistance and clustered moving averages near 8845-8910 define the immediate overhead supply region, while 8673 and 8651 remain the nearby downside pivot references. Small daily bars and subdued momentum indicate consolidation following the sharp selloff rather than a confirmed trend reversal.
Chart Analysis ATS AI Generated: 2026-09-29 07:12 for Informational use only, not trading advice. Terms and Risk Disclosure Copyright © 2026. Algo Trading Systems LLC.