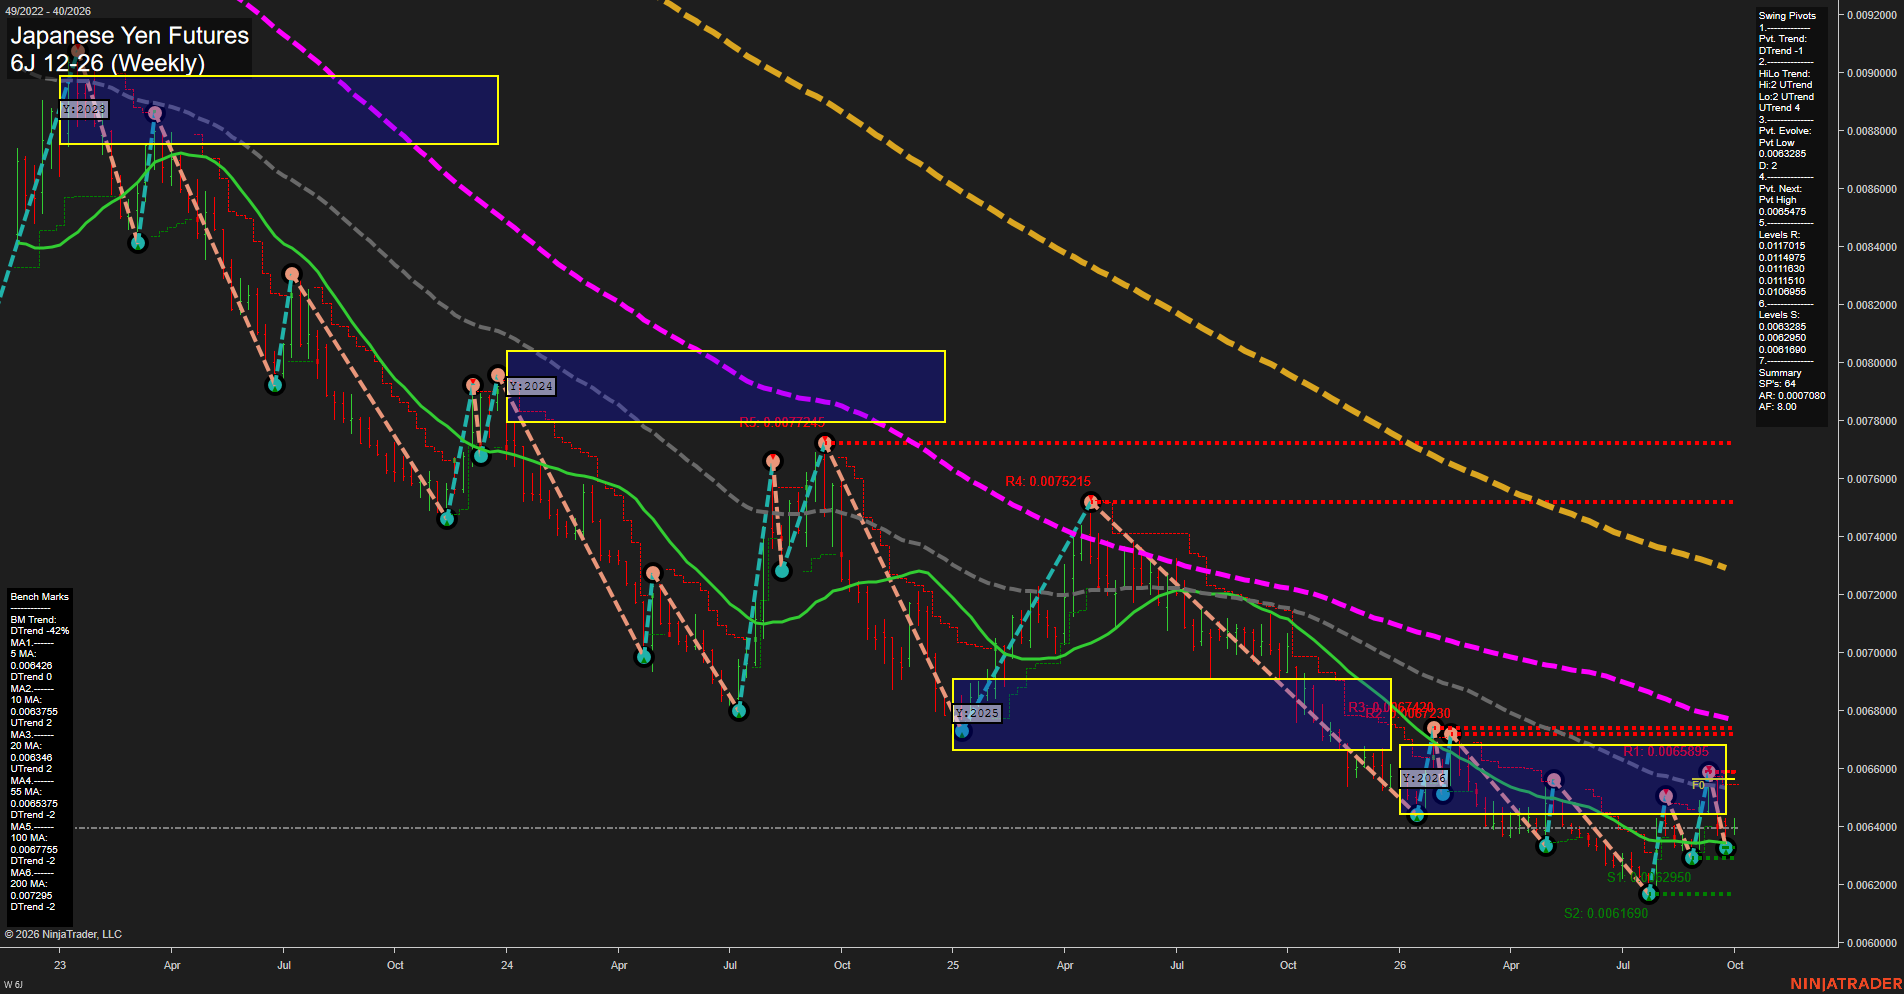
6J Japanese Yen Futures Weekly Chart Analysis: 2026-Sep-29 07:02 CT
Price Action
- Last: 0.006426,
- Bars: Small,
- Mom: Slow.
WSFG Weekly
- Short-Term
- WSFG Current: 2%
- F0%/NTZ' Bias: Price Above,
- WSFG Trend: Up.
MSFG Month Sep
- Intermediate-Term
- MSFG Current: 44%
- F0%/NTZ' Bias: Price Above,
- MSFG Trend: Up.
YSFG Year 2026
- Long-Term
- YSFG Current: -14%
- F0%/NTZ' Bias: Price Below,
- YSFG Trend: Down.
Swing Pivots
- (Short-Term) 1. Pvt. Trend: DTrend,
- (Intermediate-Term) 2. HiLo Trend: UTrend,
- 3. Pvt. Evolve: Pvt low 0.0063815,
- 4. Pvt. Next: Pvt high 0.0065475,
- 5. Levels R: 0.0117015, 0.0114975, 0.0111630, 0.0111510, 0.0106955,
- 6. Levels S: 0.0063285, 0.0062905, 0.0061690.
Weekly Benchmarks
- (Short-Term) 5 Day: 0.006426 Down Trend,
- (Short-Term) 10 Day: 0.0063755 Up Trend,
- (Intermediate-Term) 20 Day: 0.0064346 Up Trend,
- (Intermediate-Term) 55 Day: 0.0065375 Down Trend,
- (Long-Term) 100 Day: 0.0067755 Down Trend,
- (Long-Term) 200 Day: 0.007295 Down Trend.
Recent Trade Signals
- 29 Sep 2026: Short 6J 12-26 @ 0.00638 Signals.USAR-WSFG
- 25 Sep 2026: Long 6J 12-26 @ 0.0063675 Signals.USAR.TR120
Overall Rating
- Short-Term: Neutral,
- Intermediate-Term: Bullish,
- Long-Term: Bearish.
Key Insights Summary
The weekly chart is consolidating with small bars near 0.006426 after a rebound from the 0.0061690 to 0.0063285 support area. Weekly and monthly grids remain constructive above F0%, while the active short-term pivot is still down and requires a move through 0.0065475 to establish a new pivot high. The 20-week average is rising near price, but the declining 55-, 100-, and 200-week averages preserve the broader bearish structure. This reflects an intermediate-term recovery within a longer-term downtrend, with overhead moving-average compression and nearby resistance defining a choppy countertrend phase.
Chart Analysis ATS AI Generated: 2026-09-29 07:02 for Informational use only, not trading advice. Terms and Risk Disclosure Copyright © 2026. Algo Trading Systems LLC.