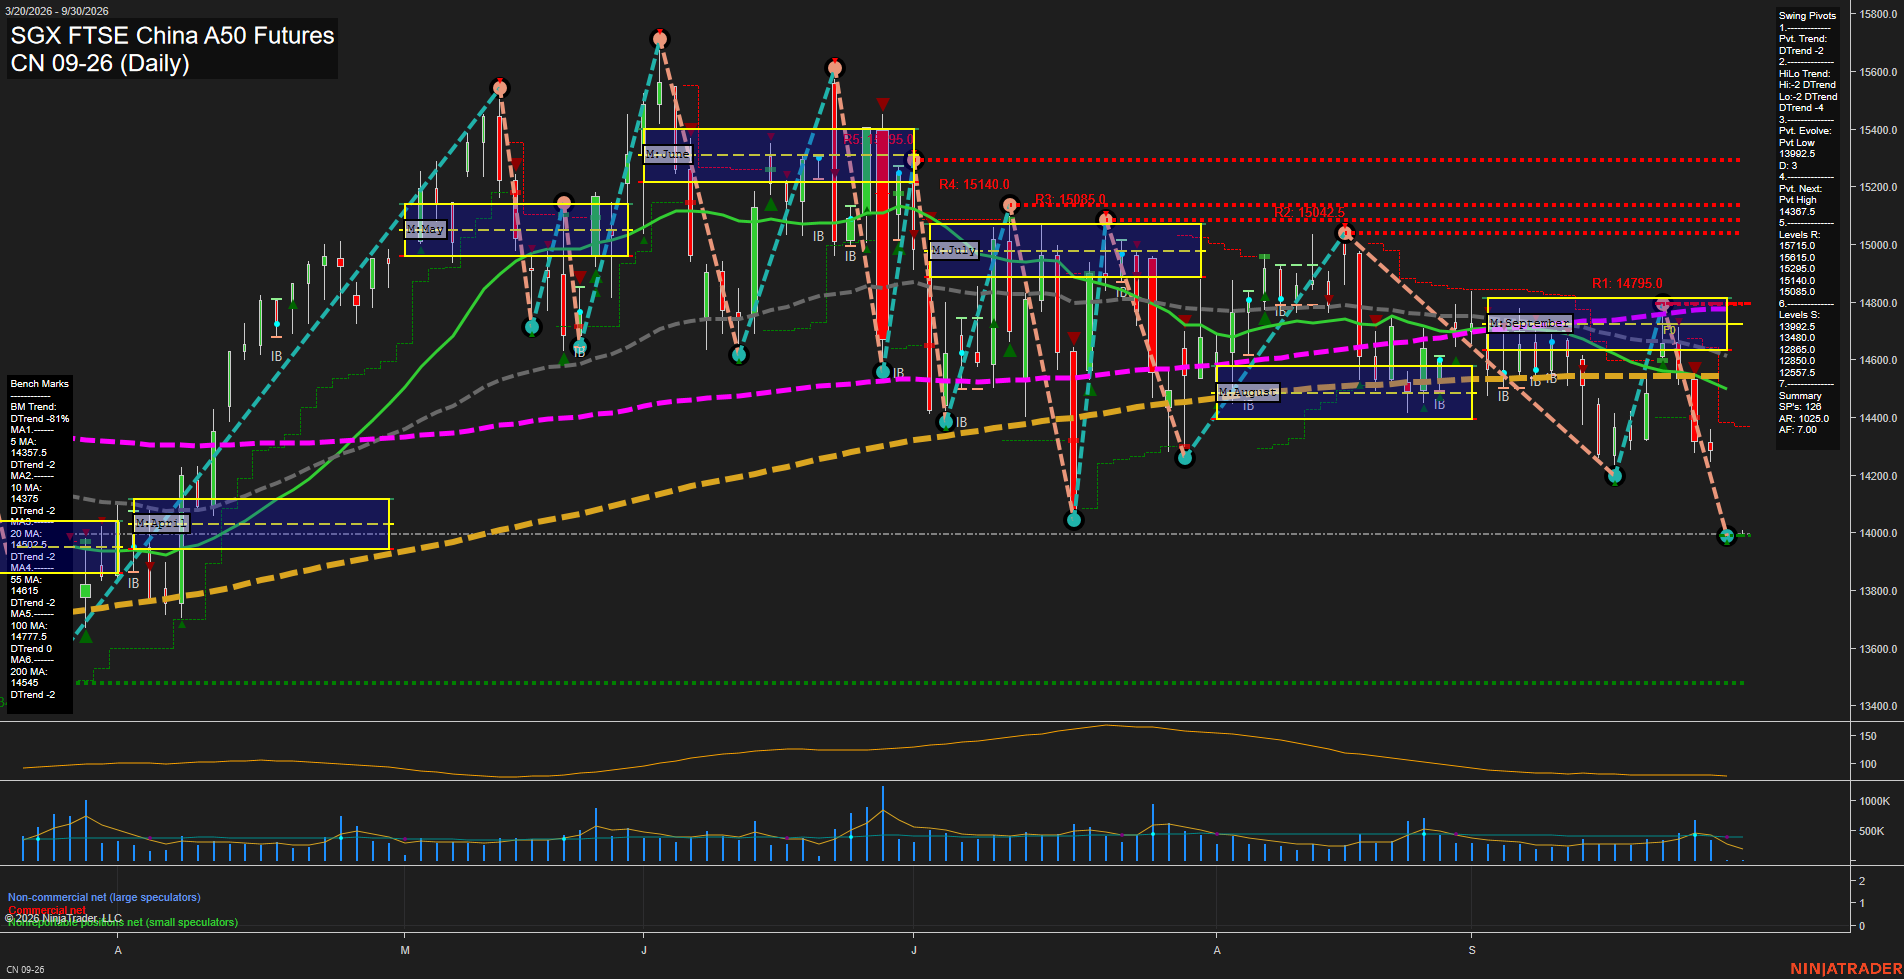
CN SGX FTSE China A50 Futures Daily Chart Analysis: 2026-Sep-28 07:03 CT
Price Action
- Last: 14000.0,
- Bars: Large,
- Mom: fast.
WSFG Weekly
- Short-Term
- WSFG Current: NA%
- F0%/NTZ' Bias: Price Neutral,
- WSFG Trend: Neutral.
MSFG Month Sep
- Intermediate-Term
- MSFG Current: NA%
- F0%/NTZ' Bias: Price Bearish,
- MSFG Trend: Bearish.
YSFG Year 2026
- Long-Term
- YSFG Current: NA%
- F0%/NTZ' Bias: Price Neutral,
- YSFG Trend: Neutral.
Swing Pivots
- (Short-Term) 1. Pvt. Trend: DTrend,
- (Intermediate-Term) 2. HiLo Trend: DTrend,
- 3. Pvt. Evolve: Pvt low 13992.5,
- 4. Pvt. Next: Pvt high 14397.0,
- 5. Levels R: 15315.0, 15295.0, 15085.0, 15042.5, 14795.0,
- 6. Levels S: 13992.5, 13480.0, 12865.0, 12557.5.
Daily Benchmarks
- (Short-Term) 5 Day: 14357.5 Down Trend,
- (Short-Term) 10 Day: 14375.0 Down Trend,
- (Intermediate-Term) 20 Day: 14557.5 Down Trend,
- (Intermediate-Term) 55 Day: 14615.0 Down Trend,
- (Long-Term) 100 Day: 14772.5 Down Trend,
- (Long-Term) 200 Day: 14545.0 Down Trend.
Additional Metrics
- ATR: 102.5,
- VOLMA: 261842.
Overall Rating
- Short-Term: Bearish,
- Intermediate-Term: Bearish,
- Long-Term: Bearish.
Key Insights Summary
Price has extended a sharp late-September selloff into the 14000.0 pivot-low area, with large daily bars and fast downside momentum confirming a short-term bearish impulse. Both pivot structures remain in DTrend, while price is below every listed benchmark average, creating broad multi-timeframe trend alignment to the downside. The 13992.5 swing-low area is the immediate structural reference, with 13480.0 the next lower support; the nearest overhead pivot reversal level is 14397.0, followed by the clustered moving-average and September grid resistance zone around 14545.0 to 14615.0. Volume has remained relatively subdued versus earlier expansion phases, while ATR near 102.5 indicates daily range volatility remains elevated despite the declining volume profile.
Chart Analysis ATS AI Generated: 2026-09-28 07:03 for Informational use only, not trading advice. Terms and Risk Disclosure Copyright © 2026. Algo Trading Systems LLC.