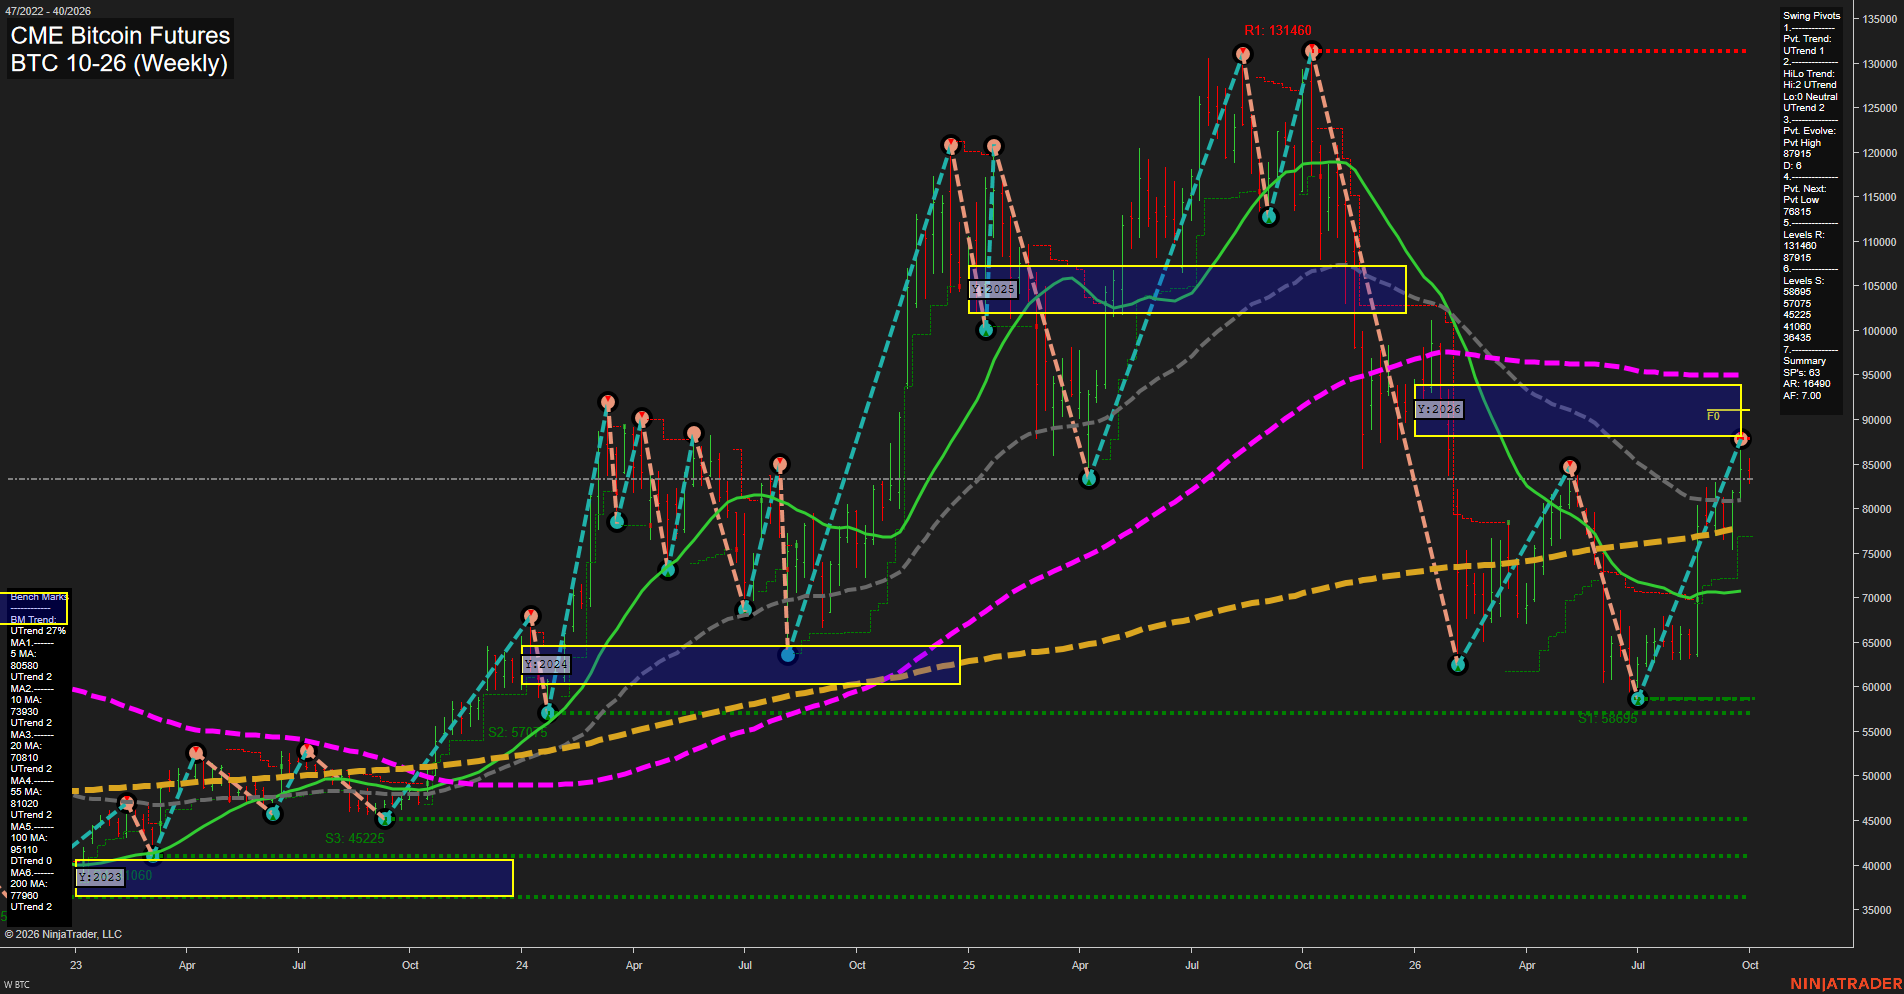
BTC CME Bitcoin Futures Weekly Chart Analysis: 2026-Sep-28 07:02 CT
Price Action
- Last: 84340,
- Bars: Medium,
- Mom: Fast.
WSFG Weekly
- Short-Term
- WSFG Current: -30%
- F0%/NTZ' Bias: Price Below,
- WSFG Trend: Down.
MSFG Month Sep
- Intermediate-Term
- MSFG Current: 30%
- F0%/NTZ' Bias: Price Above,
- MSFG Trend: Up.
YSFG Year 2026
- Long-Term
- YSFG Current: -27%
- F0%/NTZ' Bias: Price Below,
- YSFG Trend: Down.
Swing Pivots
- (Short-Term) 1. Pvt. Trend: UTrend,
- (Intermediate-Term) 2. HiLo Trend: UTrend,
- 3. Pvt. Evolve: Pvt high 87915,
- 4. Pvt. Next: Pvt low 57815,
- 5. Levels R: 131460, 87915,
- 6. Levels S: 58695, 50775, 45225, 41060, 36435.
Weekly Benchmarks
- (Short-Term) 5 Day: 80589 Up Trend,
- (Short-Term) 10 Day: 73930 Up Trend,
- (Intermediate-Term) 20 Day: 70810 Up Trend,
- (Intermediate-Term) 55 Day: 81020 Up Trend,
- (Long-Term) 100 Day: 95110 Down Trend,
- (Long-Term) 200 Day: 77890 Up Trend.
Recent Trade Signals
- 23 Sep 2026: Short BTC 09-26 @ 84340 Signals.USAR.TR120
Overall Rating
- Short-Term: Bearish,
- Intermediate-Term: Bullish,
- Long-Term: Bearish.
Key Insights Summary
BTC futures are in a sharp weekly countertrend recovery from the July pivot low, with the short-term pivot structure and 5, 10, 20, and 55 period benchmarks turning upward. Price remains below the 87915 pivot resistance and below the yearly F0%/NTZ area, leaving the broader structure defined by a lower-high recovery within a long-term down phase. The 131460 major resistance remains distant, while 58695 is the principal swing support beneath the current recovery range. The monthly grid and intermediate HiLo trend remain constructive, but the short signal, weekly grid bias, and declining 100 period benchmark characterize the current area as a technically mixed transition zone.
Chart Analysis ATS AI Generated: 2026-09-28 07:02 for Informational use only, not trading advice. Terms and Risk Disclosure Copyright © 2026. Algo Trading Systems LLC.