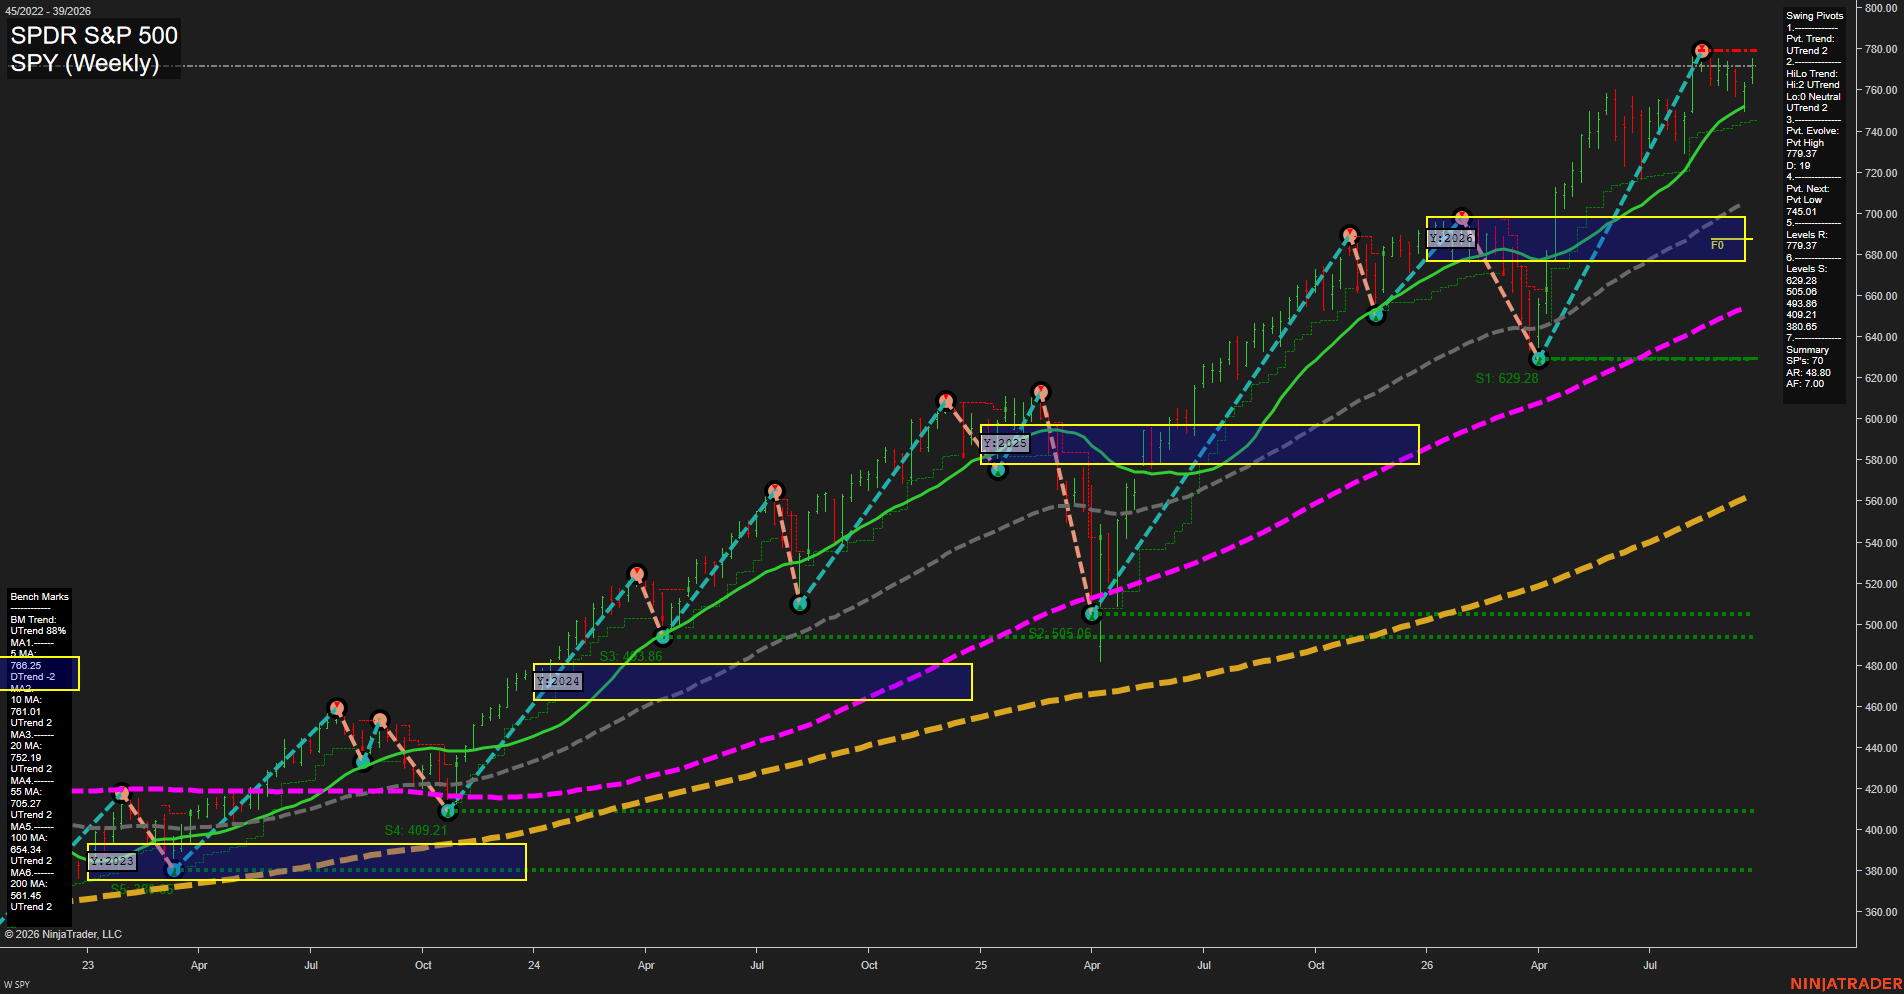
SPY SPDR S&P 500 Weekly Chart Analysis: 2026-Sep-27 18:08 CT
Price Action
- Last: 779.37,
- Bars: Small,
- Mom: Slow.
WSFG Weekly
- Short-Term
- WSFG Current: NA%
- F0%/NTZ' Bias: Price Above NTZ,
- WSFG Trend: UTrend.
MSFG Month Sep
- Intermediate-Term
- MSFG Current: NA%
- F0%/NTZ' Bias: Price Above NTZ,
- MSFG Trend: UTrend.
YSFG Year 2026
- Long-Term
- YSFG Current: NA%
- F0%/NTZ' Bias: Price Above NTZ,
- YSFG Trend: UTrend.
Swing Pivots
- (Short-Term) 1. Pvt. Trend: UTrend,
- (Intermediate-Term) 2. HiLo Trend: UTrend,
- 3. Pvt. Evolve: Pvt high 779.37,
- 4. Pvt. Next: Pvt low 745.01,
- 5. Levels R: 779.37, 690.00,
- 6. Levels S: 629.28, 505.08, 493.88, 409.21, 380.65.
Weekly Benchmarks
- (Short-Term) 5 Day: 766.25 Down Trend,
- (Short-Term) 10 Day: 761.01 Up Trend,
- (Intermediate-Term) 20 Day: 752.19 Up Trend,
- (Intermediate-Term) 55 Day: 705.27 Up Trend,
- (Long-Term) 100 Day: 654.34 Up Trend,
- (Long-Term) 200 Day: 581.45 Up Trend.
Overall Rating
- Short-Term: Bullish,
- Intermediate-Term: Bullish,
- Long-Term: Bullish.
Key Insights Summary
For a futures swing-trader market-structure view, the SPY weekly chart reflects a broad bullish ES-equivalent trend: price is holding above all rising intermediate- and long-term benchmarks while both pivot trend measures remain in UTrend. The market is consolidating near the 779.37 pivot high with smaller weekly bars and slower momentum, indicating an extended advance transitioning into a tighter high-level balance rather than a confirmed reversal. The 745.01 pivot-next level defines the nearest structural downside reversal point, while 779.37 remains the immediate breakout reference. The yearly NTZ/F0% area near the upper-680s is well below current price, reinforcing the strength of the larger trend and identifying the prior consolidation zone as a major longer-term support region.
Chart Analysis ATS AI Generated: 2026-09-27 18:08 for Informational use only, not trading advice. Terms and Risk Disclosure Copyright © 2026. Algo Trading Systems LLC.