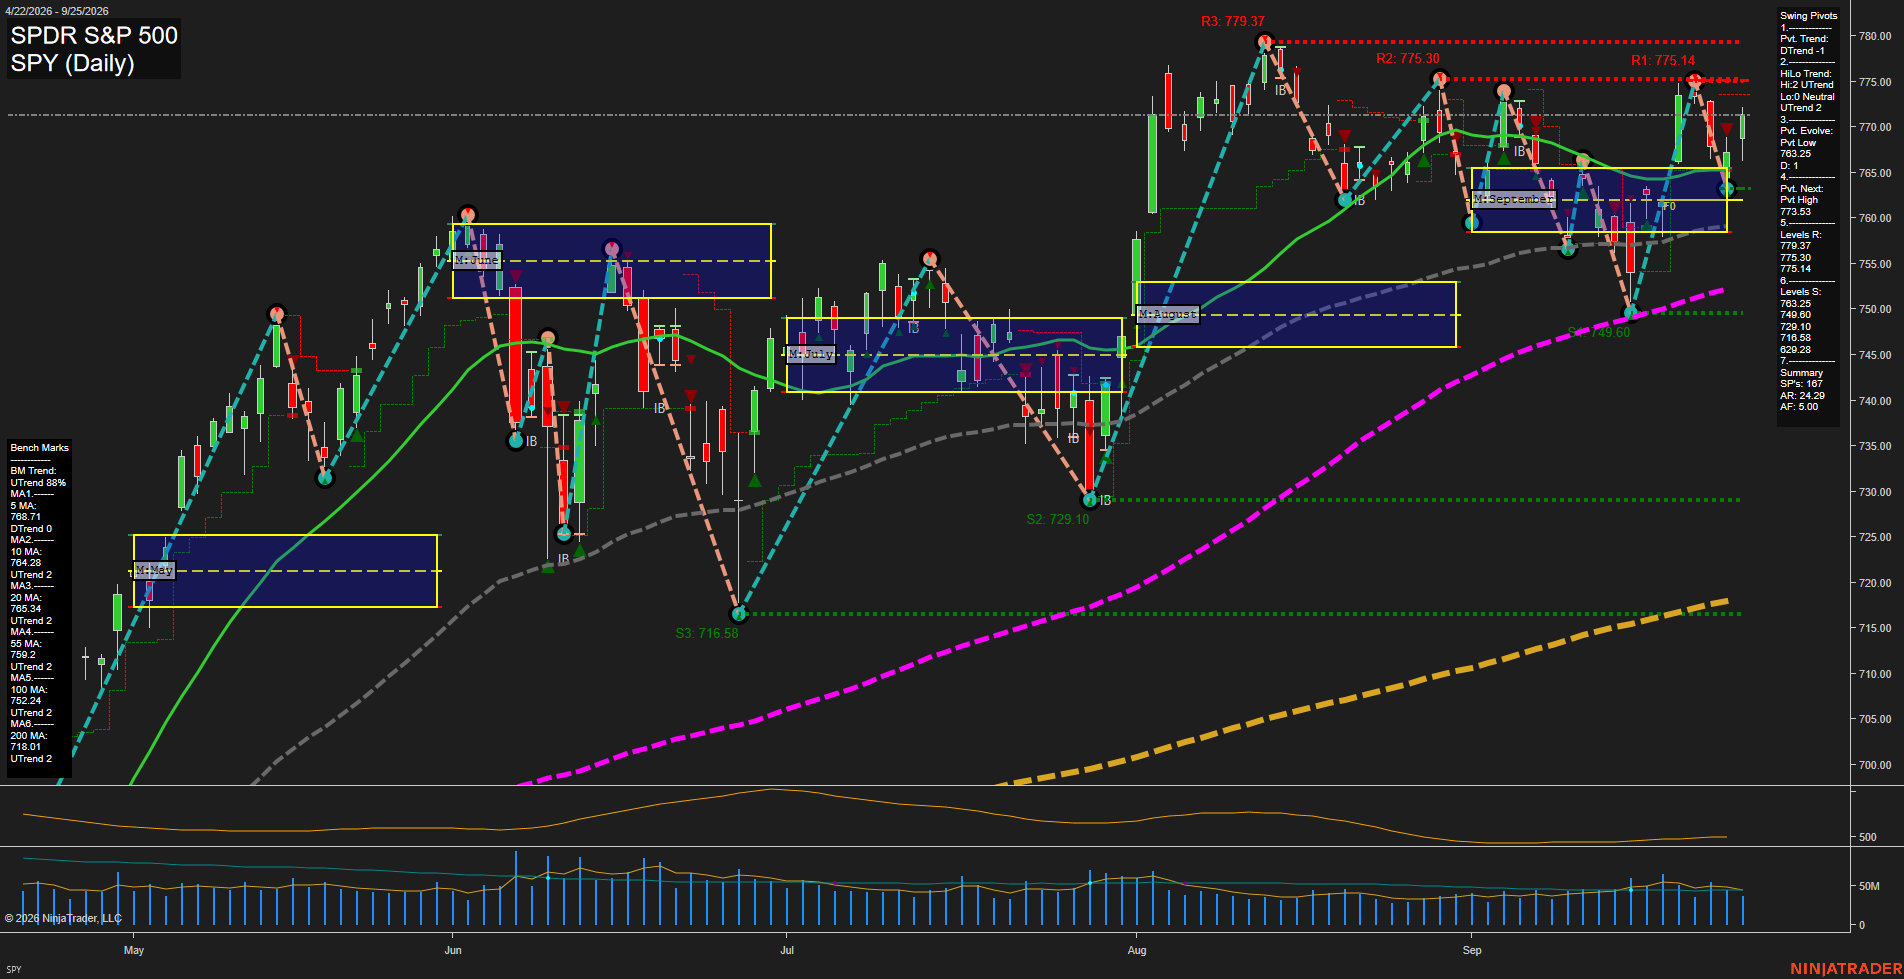
SPY SPDR S&P 500 Daily Chart Analysis: 2026-Sep-27 18:08 CT
Price Action
- Last: 771.37,
- Bars: Medium,
- Mom: Average.
WSFG Weekly
- Short-Term
- WSFG Current: NA%
- F0%/NTZ' Bias: Price Neutral,
- WSFG Trend: Neutral.
MSFG Month Sep
- Intermediate-Term
- MSFG Current: NA%
- F0%/NTZ' Bias: Price Bullish,
- MSFG Trend: Bullish.
YSFG Year 2026
- Long-Term
- YSFG Current: NA%
- F0%/NTZ' Bias: Price Neutral,
- YSFG Trend: Neutral.
Swing Pivots
- (Short-Term) 1. Pvt. Trend: DTrend,
- (Intermediate-Term) 2. HiLo Trend: UTrend,
- 3. Pvt. Evolve: Pvt low 763.25,
- 4. Pvt. Next: Pvt high 773.53,
- 5. Levels R: 779.37, 775.30, 775.14,
- 6. Levels S: 763.25, 749.60, 729.10, 716.58, 702.28.
Daily Benchmarks
- (Short-Term) 5 Day: 768.71 Up Trend,
- (Short-Term) 10 Day: 764.28 Up Trend,
- (Intermediate-Term) 20 Day: 765.34 Up Trend,
- (Intermediate-Term) 55 Day: 759.20 Up Trend,
- (Long-Term) 100 Day: 752.24 Up Trend,
- (Long-Term) 200 Day: 718.01 Up Trend.
Additional Metrics
- ATR: 24.29,
- VOLMA: 5000000.
Overall Rating
- Short-Term: Neutral,
- Intermediate-Term: Bullish,
- Long-Term: Bullish.
Key Insights Summary
SPY is trading above all six rising benchmark averages, preserving the broader futures-equivalent index structure of higher highs and higher lows. The intermediate pivot trend remains upward, while the short-term pivot status is in a DTrend retracement after rejection from the 775.14-775.30 resistance cluster. Price has rebounded from 763.25 support and is back above the September monthly grid, placing 773.53 and then 775.14-775.30 at the immediate upside pivot zone. The 763.25 level is the near-term structural reference; beneath it, the next visible supports are 749.60 and 729.10. ATR at 24.29 reflects active daily-range conditions, while volume remains comparatively contained, characterizing the current recovery as a measured consolidation within a bullish intermediate and long-term trend.
Chart Analysis ATS AI Generated: 2026-09-27 18:08 for Informational use only, not trading advice. Terms and Risk Disclosure Copyright © 2026. Algo Trading Systems LLC.