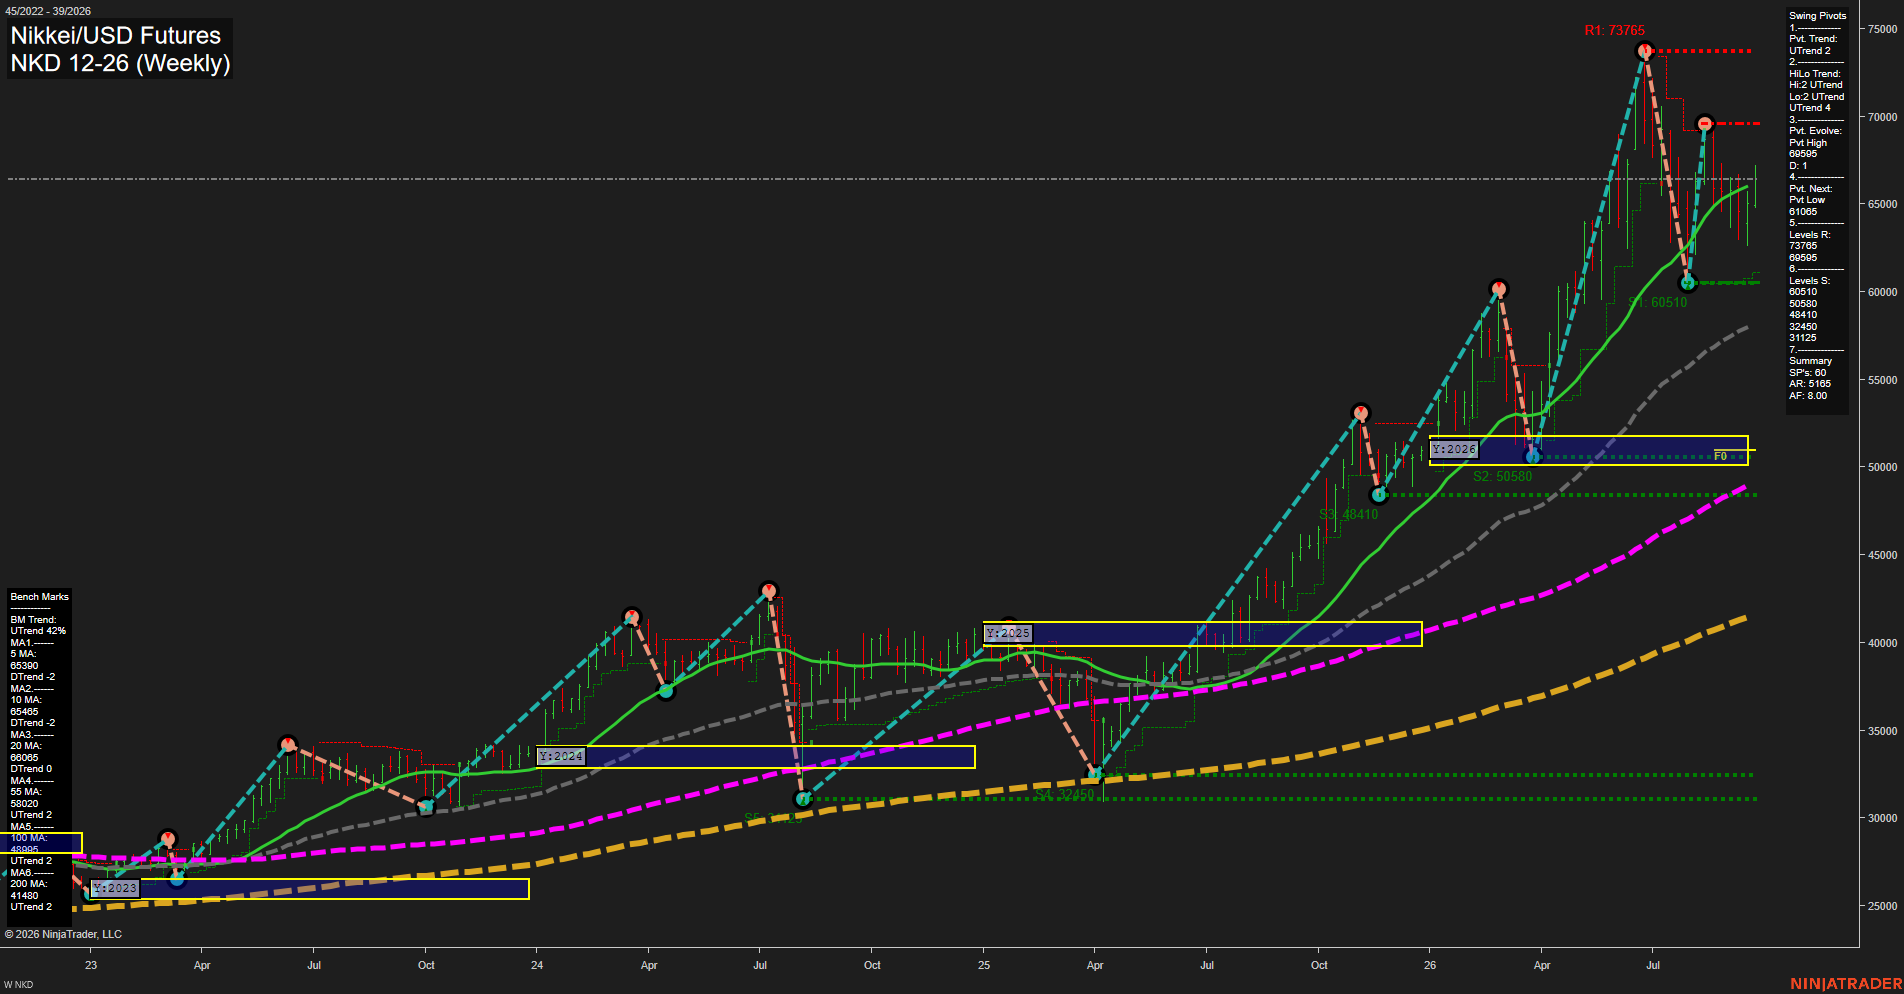
NKD Nikkei/USD Futures Weekly Chart Analysis: 2026-Sep-25 07:12 CT
Price Action
- Last: 65895,
- Bars: Medium,
- Mom: Momentum fast.
WSFG Weekly
- Short-Term
- WSFG Current: 52%
- F0%/NTZ' Bias: Price Above,
- WSFG Trend: Up.
MSFG Month Sep
- Intermediate-Term
- MSFG Current: 3%
- F0%/NTZ' Bias: Price Above,
- MSFG Trend: Up.
YSFG Year 2026
- Long-Term
- YSFG Current: 186%
- F0%/NTZ' Bias: Price Above,
- YSFG Trend: Up.
Swing Pivots
- (Short-Term) 1. Pvt. Trend: UTrend,
- (Intermediate-Term) 2. HiLo Trend: UTrend,
- 3. Pvt. Evolve: Pvt high 69595,
- 4. Pvt. Next: Pvt low 61085,
- 5. Levels R: 73765, 69595,
- 6. Levels S: 60510, 50580, 48410, 32450, 31125.
Weekly Benchmarks
- (Short-Term) 5 Day: 65390 Down Trend,
- (Short-Term) 10 Day: 65405 Down Trend,
- (Intermediate-Term) 20 Day: 66085 Down Trend,
- (Intermediate-Term) 55 Day: 58020 Up Trend,
- (Long-Term) 100 Day: 48995 Up Trend,
- (Long-Term) 200 Day: 41180 Up Trend.
Recent Trade Signals
- 20 Sep 2026: Long NKD 12-26 @ 65185 Signals.USAR-WSFG
Overall Rating
- Short-Term: Bullish,
- Intermediate-Term: Bullish,
- Long-Term: Bullish.
Key Insights Summary
Price remains in a broad higher-high and higher-low weekly advance, with all Fib-grid trends positive and the intermediate and long-term benchmark structure strongly aligned upward. The recent decline from the 69595 pivot high produced a sharp pullback, but price has rebounded above the weekly and monthly Fib reference areas and remains well above the rising 55, 100, and 200 period benchmarks. Short-term conditions are fast and somewhat choppy around the 5, 10, and 20 period averages, while 69595 is the immediate pivot resistance and 60510 is the principal structural support.
Chart Analysis ATS AI Generated: 2026-09-25 07:12 for Informational use only, not trading advice. Terms and Risk Disclosure Copyright © 2026. Algo Trading Systems LLC.