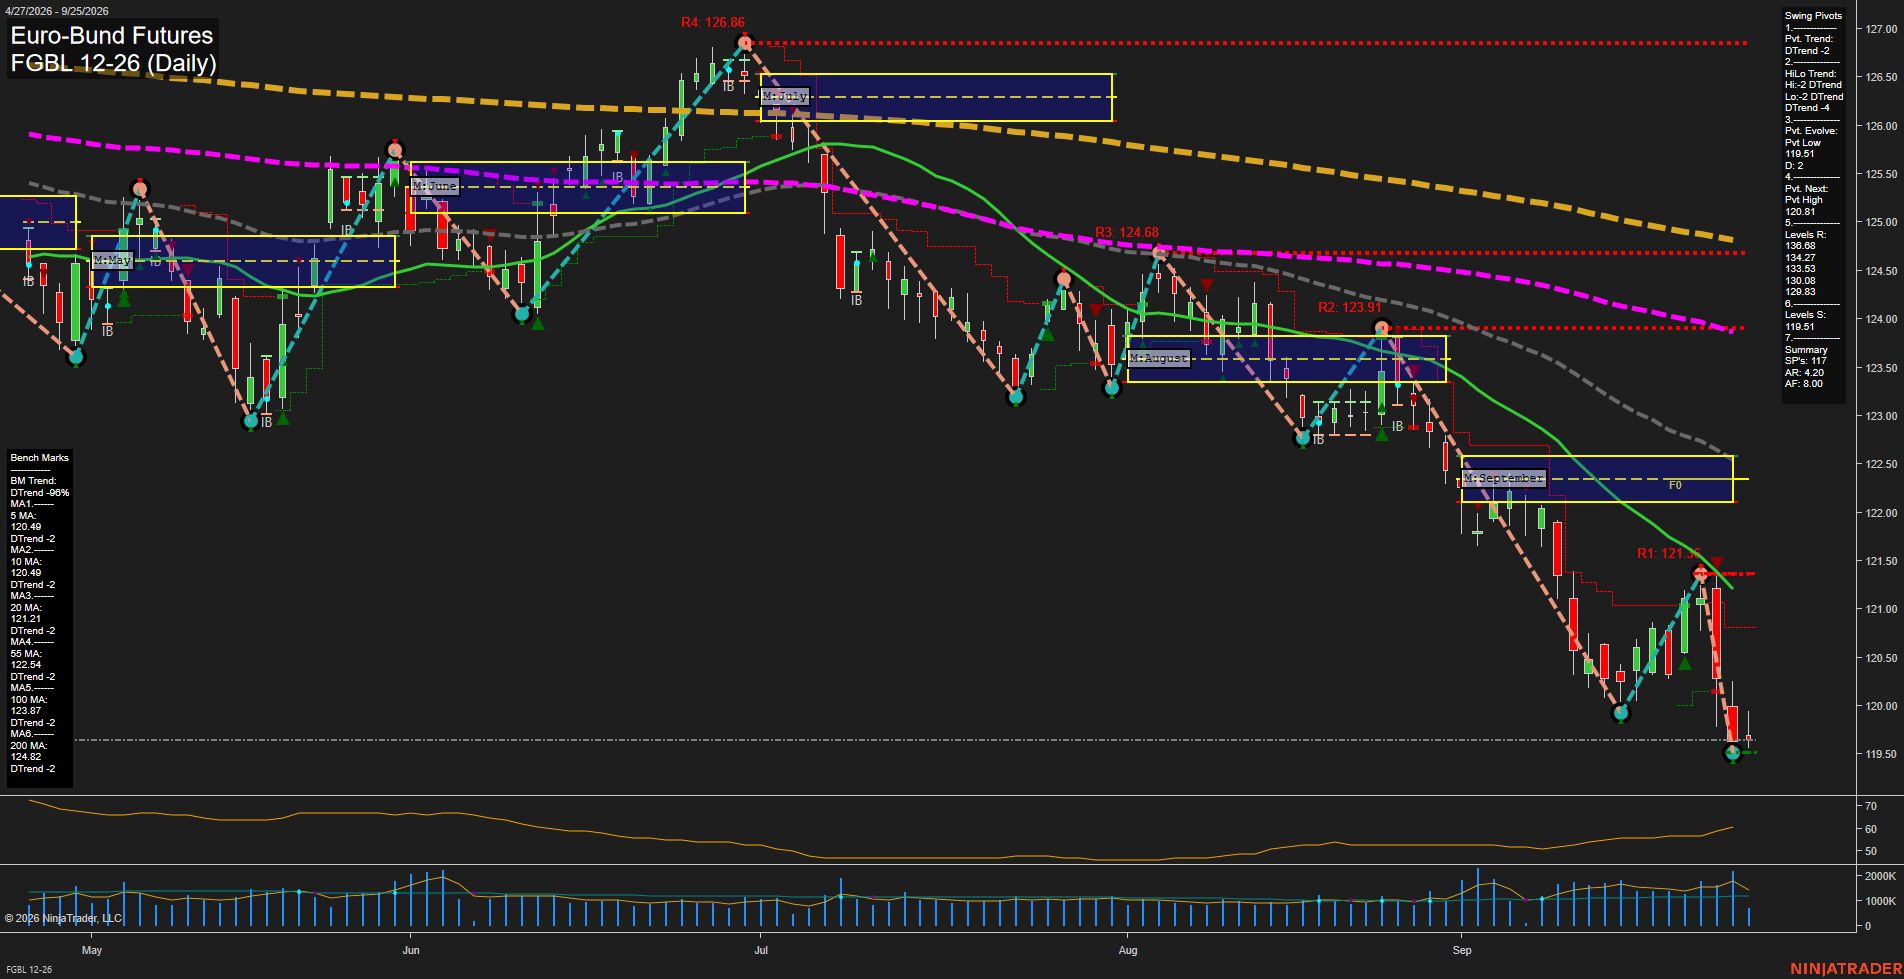
FGBL Euro-Bund Futures Daily Chart Analysis: 2026-Sep-25 07:08 CT
Price Action
- Last: 119.57,
- Bars: Large,
- Mom: fast.
WSFG Weekly
- Short-Term
- WSFG Current: -67%
- F0%/NTZ' Bias: Price Below,
- WSFG Trend: Down.
MSFG Month Sep
- Intermediate-Term
- MSFG Current: -107%
- F0%/NTZ' Bias: Price Below,
- MSFG Trend: Down.
YSFG Year 2026
- Long-Term
- YSFG Current: -51%
- F0%/NTZ' Bias: Price Below,
- YSFG Trend: Down.
Swing Pivots
- (Short-Term) 1. Pvt. Trend: DTrend,
- (Intermediate-Term) 2. HiLo Trend: DTrend,
- 3. Pvt. Evolve: Pvt low 119.51,
- 4. Pvt. Next: Pvt high 121.36,
- 5. Levels R: 136.68, 134.27, 133.53, 130.08, 129.83,
- 6. Levels S: 119.51, 117.91.
Daily Benchmarks
- (Short-Term) 5 Day: 120.49 Down Trend,
- (Short-Term) 10 Day: 120.49 Down Trend,
- (Intermediate-Term) 20 Day: 121.21 Down Trend,
- (Intermediate-Term) 55 Day: 122.45 Down Trend,
- (Long-Term) 100 Day: 123.87 Down Trend,
- (Long-Term) 200 Day: 124.83 Down Trend.
Additional Metrics
Recent Trade Signals
- 23 Sep 2026: Short FGBL 12-26 @ 120.37 Signals.USAR-WSFG
- 23 Sep 2026: Short FGBL 12-26 @ 120.37 Signals.USAR.TR120
Overall Rating
- Short-Term: Bearish,
- Intermediate-Term: Bearish,
- Long-Term: Bearish.
Key Insights Summary
Euro-Bund futures remain in a broad bearish swing structure, with price extending below the September monthly F0%/NTZ area and pressing the 119.51 pivot-low region. The latest decline followed a failed rebound into the 121.36 pivot-high area, preserving the pattern of lower highs and lower lows. Fast downside momentum, large daily bars, and price below all six declining benchmarks confirm synchronized short-, intermediate-, and long-term weakness. The decline is becoming extended beneath the weekly, monthly, and yearly Fib-grid reference zones, while ATR and volume activity indicate an active directional selloff rather than a quiet consolidation.
Chart Analysis ATS AI Generated: 2026-09-25 07:08 for Informational use only, not trading advice. Terms and Risk Disclosure Copyright © 2026. Algo Trading Systems LLC.