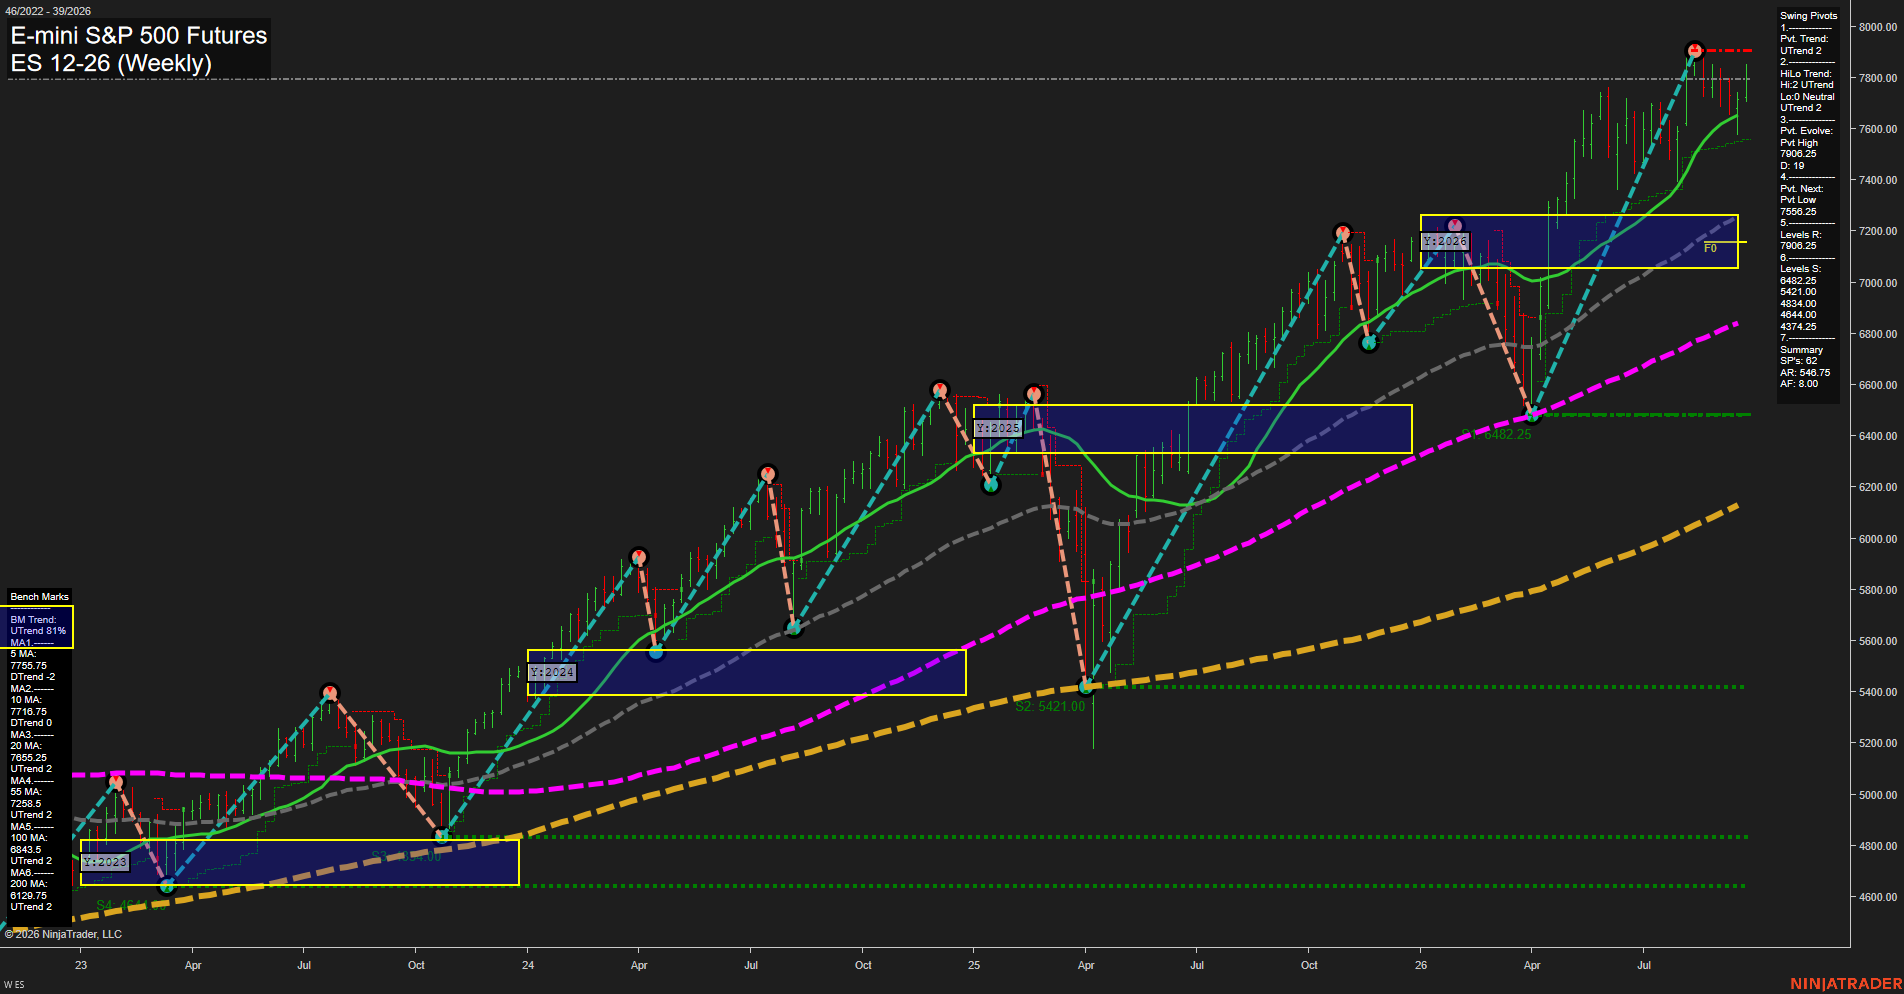
ES E-mini S&P 500 Futures Weekly Chart Analysis: 2026-Sep-25 07:06 CT
Price Action
- Last: 7792.5,
- Bars: Medium,
- Mom: average.
WSFG Weekly
- Short-Term
- WSFG Current: 50%
- F0%/NTZ' Bias: Price Above,
- WSFG Trend: Up.
MSFG Month Sep
- Intermediate-Term
- MSFG Current: 10%
- F0%/NTZ' Bias: Price Above,
- MSFG Trend: Up.
YSFG Year 2026
- Long-Term
- YSFG Current: 61%
- F0%/NTZ' Bias: Price Above,
- YSFG Trend: Up.
Swing Pivots
- (Short-Term) 1. Pvt. Trend: UTrend,
- (Intermediate-Term) 2. HiLo Trend: UTrend,
- 3. Pvt. Evolve: Pvt high 7906.25,
- 4. Pvt. Next: Pvt low 7550.25,
- 5. Levels R: 7906.25,
- 6. Levels S: 6482.25, 5421.00, 4834.00, 4641.00, 4374.25.
Weekly Benchmarks
- (Short-Term) 5 Day: 7755.75 Up Trend,
- (Short-Term) 10 Day: 7716.75 Up Trend,
- (Intermediate-Term) 20 Day: 7655.25 Up Trend,
- (Intermediate-Term) 55 Day: 7258.50 Up Trend,
- (Long-Term) 100 Day: 6843.50 Up Trend,
- (Long-Term) 200 Day: 6129.75 Up Trend.
Recent Trade Signals
- 25 Sep 2026: Long ES 12-26 @ 7792.5 Signals.USAR-MSFG
- 25 Sep 2026: Long ES 12-26 @ 7787 Signals.USAR.TR120
- 25 Sep 2026: Long ES 12-26 @ 7751.75 Signals.USAR-WSFG
- 21 Sep 2026: Long ES 12-26 @ 7805.25 Signals.USAR.TR720
Overall Rating
- Short-Term: Bullish,
- Intermediate-Term: Bullish,
- Long-Term: Bullish.
Key Insights Summary
ES remains in a broad weekly uptrend, supported by aligned UTrend pivot structure and price holding above all six rising benchmark averages. The recent advance has carried price close to the 7906.25 pivot-high resistance, where the weekly bars show consolidation following a fast recovery from the 6482.25 swing low. The active pivot sequence remains higher-high and higher-low constructive, while 7550.25 defines the next opposite-pivot level. Weekly, monthly, and yearly Fib-grid positioning are all above their F0%/NTZ references, and the recent signal set is uniformly long across short-, intermediate-, and long-term trend models.
Chart Analysis ATS AI Generated: 2026-09-25 07:07 for Informational use only, not trading advice. Terms and Risk Disclosure Copyright © 2026. Algo Trading Systems LLC.