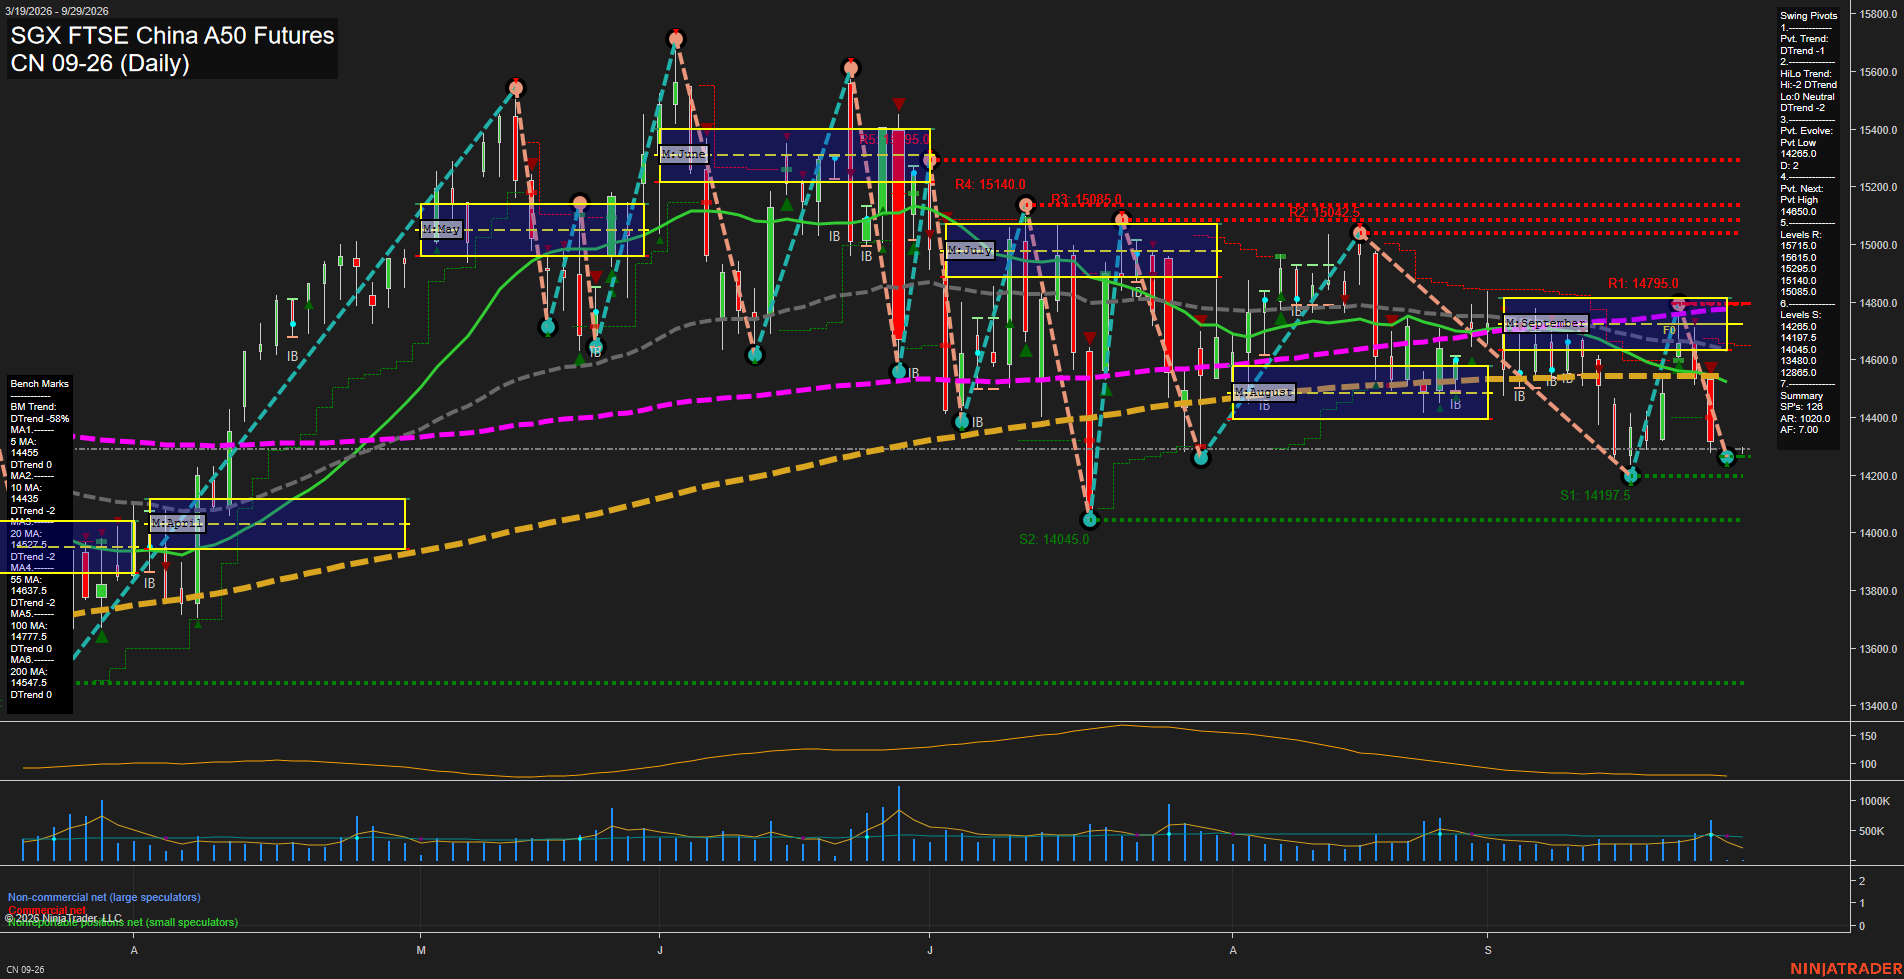
CN SGX FTSE China A50 Futures Daily Chart Analysis: 2026-Sep-25 07:04 CT
Price Action
- Last: 14285.0,
- Bars: Large,
- Mom: fast.
WSFG Weekly
- Short-Term
- WSFG Current: NA%
- F0%/NTZ' Bias: Price Neutral,
- WSFG Trend: Neutral.
MSFG Month Sep
- Intermediate-Term
- MSFG Current: NA%
- F0%/NTZ' Bias: Price Below NTZ,
- MSFG Trend: Downtrend.
YSFG Year 2026
- Long-Term
- YSFG Current: NA%
- F0%/NTZ' Bias: Price Neutral,
- YSFG Trend: Neutral.
Swing Pivots
- (Short-Term) 1. Pvt. Trend: DTrend,
- (Intermediate-Term) 2. HiLo Trend: DTrend,
- 3. Pvt. Evolve: Pvt low 14285.0,
- 4. Pvt. Next: Pvt high 14650.0,
- 5. Levels R: 15315.0, 15295.0, 15085.0, 15015.0,
- 6. Levels S: 14265.0, 14197.5, 14045.0, 13880.0.
Daily Benchmarks
- (Short-Term) 5 Day: 14445.0 Down Trend,
- (Short-Term) 10 Day: 14435.0 Down Trend,
- (Intermediate-Term) 20 Day: 14523.0 Down Trend,
- (Intermediate-Term) 55 Day: 14637.5 Down Trend,
- (Long-Term) 100 Day: 14772.5 Down Trend,
- (Long-Term) 200 Day: 14547.5 Down Trend.
Additional Metrics
- ATR: 102.0,
- VOLMA: 261842.
Overall Rating
- Short-Term: Bearish,
- Intermediate-Term: Bearish,
- Long-Term: Bearish.
Key Insights Summary
Price has accelerated lower beneath every benchmark average and below the September monthly NTZ, confirming broad downside alignment across the daily swing structure. The active pivot is a new low at 14285.0, with nearby support clustered at 14265.0 and 14197.5; lower structural supports are 14045.0 and 13880.0. The 14650.0 pivot-next level defines the nearest upside swing reversal threshold, while 14795.0 through 15315.0 represent progressively heavier overhead resistance. Large recent bars and elevated ATR reflect a volatile selloff phase rather than a quiet consolidation, with lower highs and lower lows intact.
Chart Analysis ATS AI Generated: 2026-09-25 07:05 for Informational use only, not trading advice. Terms and Risk Disclosure Copyright © 2026. Algo Trading Systems LLC.