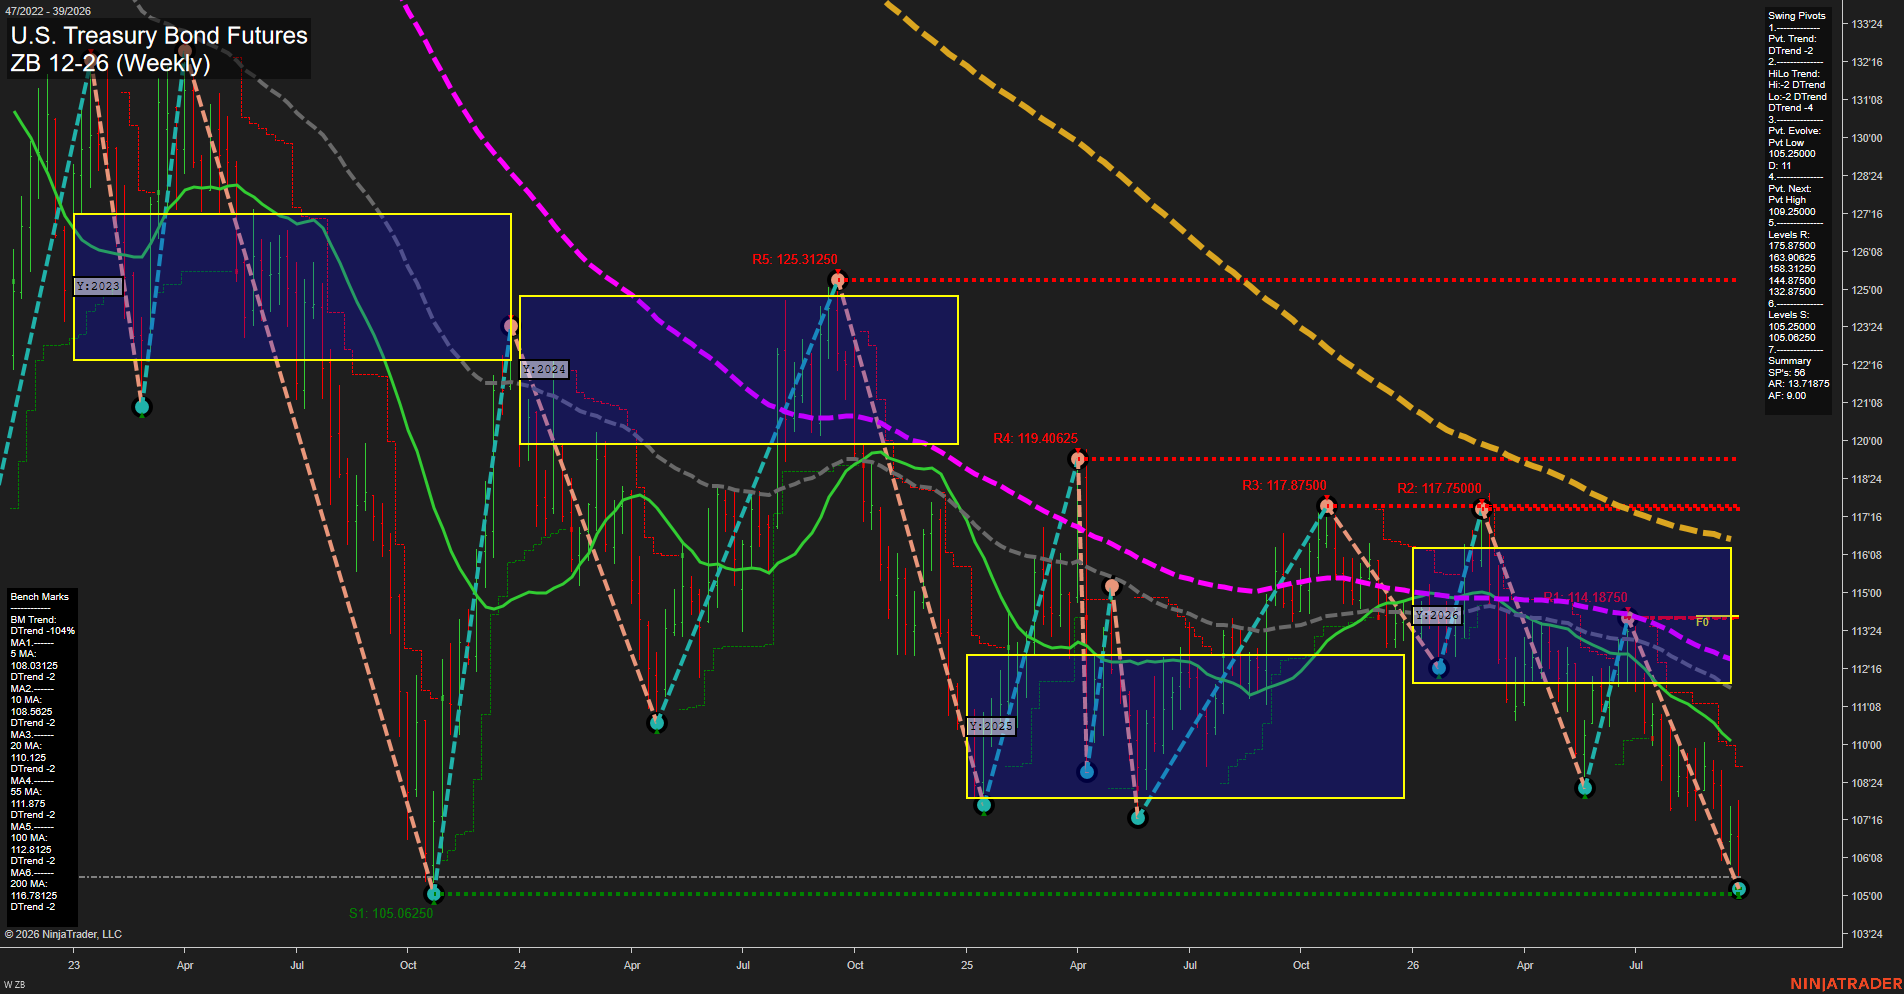
ZB U.S. Treasury Bond Futures Weekly Chart Analysis: 2026-Sep-24 07:14 CT
Price Action
- Last: 105.46875,
- Bars: Large,
- Mom: fast.
WSFG Weekly
- Short-Term
- WSFG Current: NA%
- F0%/NTZ' Bias: Price Neutral,
- WSFG Trend: Neutral.
MSFG Month Sep
- Intermediate-Term
- MSFG Current: NA%
- F0%/NTZ' Bias: Price Neutral,
- MSFG Trend: Neutral.
YSFG Year 2026
- Long-Term
- YSFG Current: NA%
- F0%/NTZ' Bias: Price Below NTZ,
- YSFG Trend: Bearish.
Swing Pivots
- (Short-Term) 1. Pvt. Trend: DTrend,
- (Intermediate-Term) 2. HiLo Trend: DTrend,
- 3. Pvt. Evolve: Pvt low 105.0000,
- 4. Pvt. Next: Pvt high 109.2500,
- 5. Levels R: 175.87500, 163.90625, 158.31250, 144.87500, 132.87500,
- 6. Levels S: 105.25000, 105.06250.
Weekly Benchmarks
- (Short-Term) 5 Day: 108.03125 Down Trend,
- (Short-Term) 10 Day: 108.56250 Down Trend,
- (Intermediate-Term) 20 Day: 110.12500 Down Trend,
- (Intermediate-Term) 55 Day: 111.87500 Down Trend,
- (Long-Term) 100 Day: 112.81250 Down Trend,
- (Long-Term) 200 Day: 116.78125 Down Trend.
Overall Rating
- Short-Term: Bearish,
- Intermediate-Term: Bearish,
- Long-Term: Bearish.
Key Insights Summary
ZB remains in a broad weekly decline, with a fresh 105.0000 pivot low and fast downside momentum confirming persistent selling pressure. Price is beneath every benchmark average, while the averages remain aligned in declining order from the short-term through the 200-day major trend measure. The pivot structure retains lower highs and lower lows, and the 2026 yearly grid has been decisively lost below its NTZ range. The nearby 105.25000 and 105.06250 support levels frame the current low area; 109.2500 is the pivot reversal threshold required to form the next short-term swing high. The chart remains technically oversold in location, but its prevailing weekly structure is bearish rather than a confirmed recovery pattern.
Chart Analysis ATS AI Generated: 2026-09-24 07:14 for Informational use only, not trading advice. Terms and Risk Disclosure Copyright © 2026. Algo Trading Systems LLC.