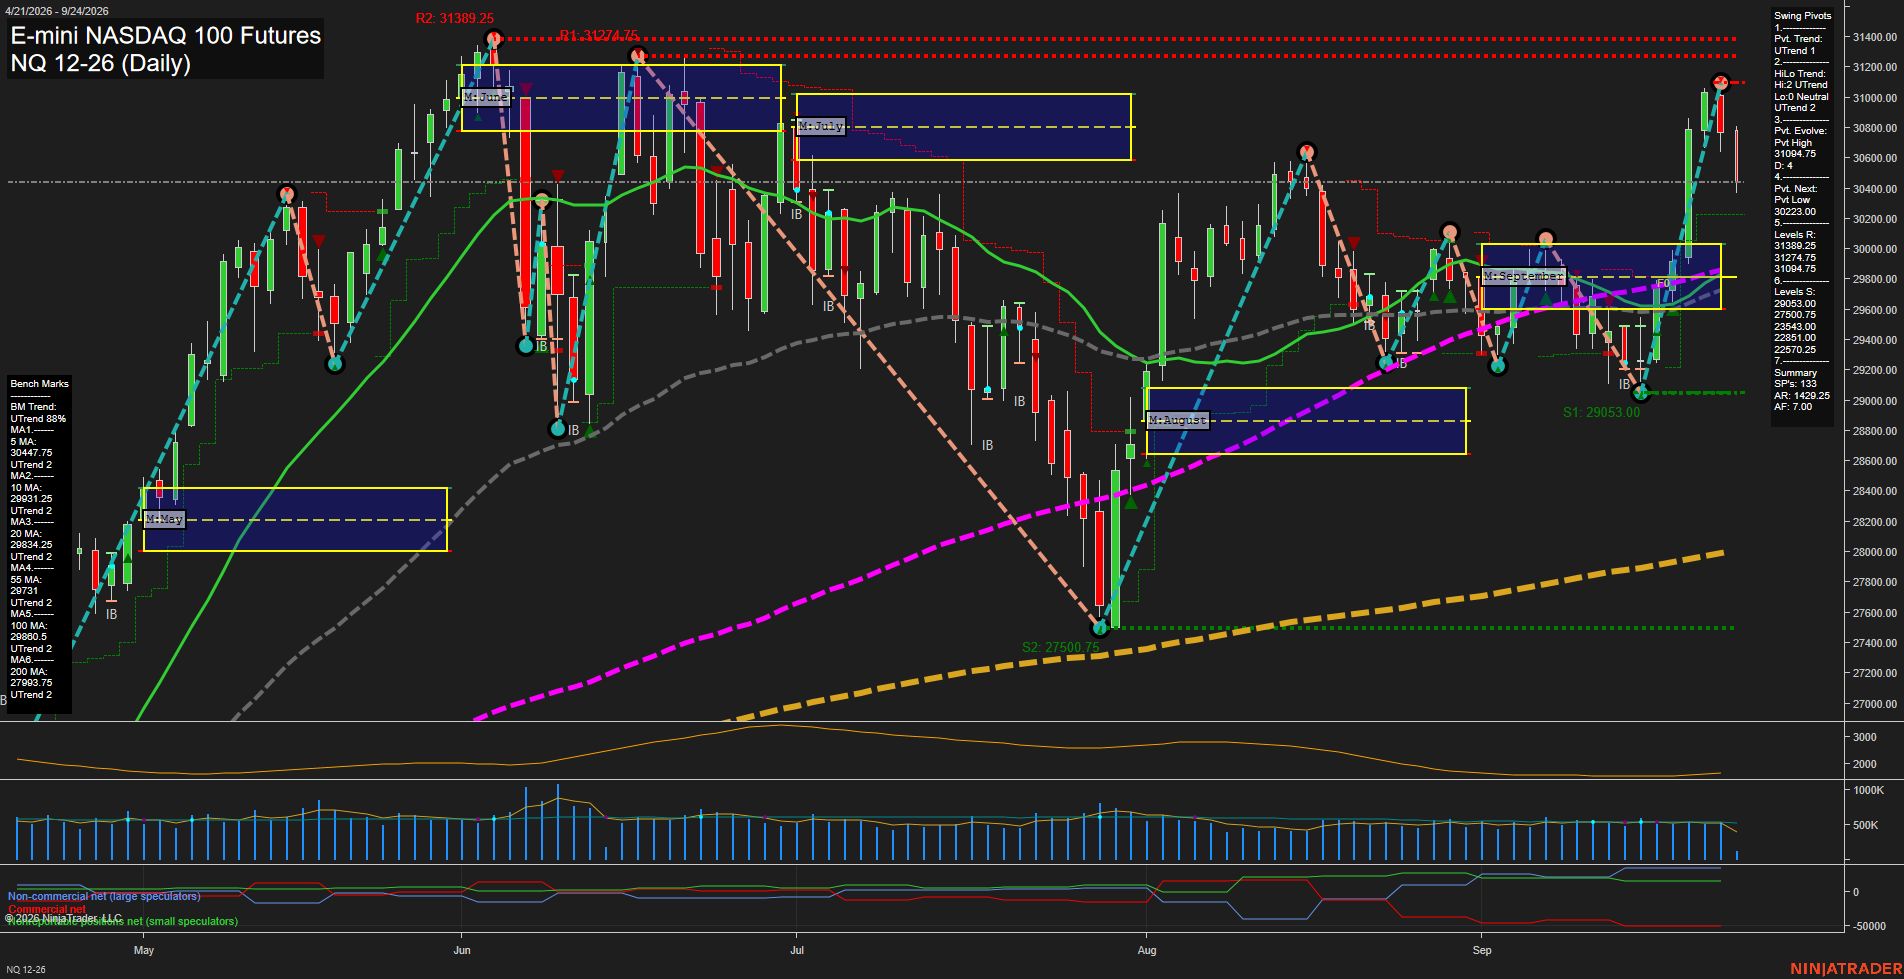
NQ E-mini NASDAQ 100 Futures Daily Chart Analysis: 2026-Sep-24 07:08 CT
Price Action
- Last: 30447.5,
- Bars: Medium,
- Mom: Fast.
WSFG Weekly
- Short-Term
- WSFG Current: 66%
- F0%/NTZ' Bias: Price Above,
- WSFG Trend: Up.
MSFG Month Sep
- Intermediate-Term
- MSFG Current: 31%
- F0%/NTZ' Bias: Price Above,
- MSFG Trend: Up.
YSFG Year 2026
- Long-Term
- YSFG Current: 87%
- F0%/NTZ' Bias: Price Above,
- YSFG Trend: Up.
Swing Pivots
- (Short-Term) 1. Pvt. Trend: UTrend,
- (Intermediate-Term) 2. HiLo Trend: UTrend,
- 3. Pvt. Evolve: Pvt high 31094.75,
- 4. Pvt. Next: Pvt low 30223.00,
- 5. Levels R: 31389.25, 31274.75, 31094.75,
- 6. Levels S: 29633.00, 27500.75, 23543.00, 22851.00, 22750.25.
Daily Benchmarks
- (Short-Term) 5 Day: 30447.75 Up Trend,
- (Short-Term) 10 Day: 29931.25 Up Trend,
- (Intermediate-Term) 20 Day: 29834.25 Up Trend,
- (Intermediate-Term) 55 Day: 29731 Up Trend,
- (Long-Term) 100 Day: 29860.5 Up Trend,
- (Long-Term) 200 Day: 27793.75 Up Trend.
Additional Metrics
- ATR: 1618,
- VOLMA: 626746.
Recent Trade Signals
- 23 Sep 2026: Short NQ 12-26 @ 30771 Signals.USAR.TR120
- 21 Sep 2026: Long NQ 12-26 @ 30610.25 Signals.USAR.TR720
- 21 Sep 2026: Long NQ 12-26 @ 30090.25 Signals.USAR-WSFG
- 21 Sep 2026: Long NQ 12-26 @ 30029.5 Signals.USAR-MSFG
Overall Rating
- Short-Term: Bullish,
- Intermediate-Term: Bullish,
- Long-Term: Bullish.
Key Insights Summary
Price remains in a broad bullish swing structure, holding above the weekly, monthly, and yearly F0% levels while all benchmark averages retain upward trends. The advance into 31094.75 produced a short-term pivot high and a medium-sized pullback bar, reflecting rejection and consolidation beneath nearby resistance at 31094.75 through 31389.25. The 30223.00 pivot-next level defines the immediate short-term swing threshold, while the clustered 55-, 100-, and 20-day averages near 29731 to 29860 provide an important intermediate support zone. The recent structure remains characterized by higher lows from the August low, although fast momentum and elevated ATR conditions show that the current rally phase has become more volatile and two-sided near the upper range.
Chart Analysis ATS AI Generated: 2026-09-24 07:08 for Informational use only, not trading advice. Terms and Risk Disclosure Copyright © 2026. Algo Trading Systems LLC.