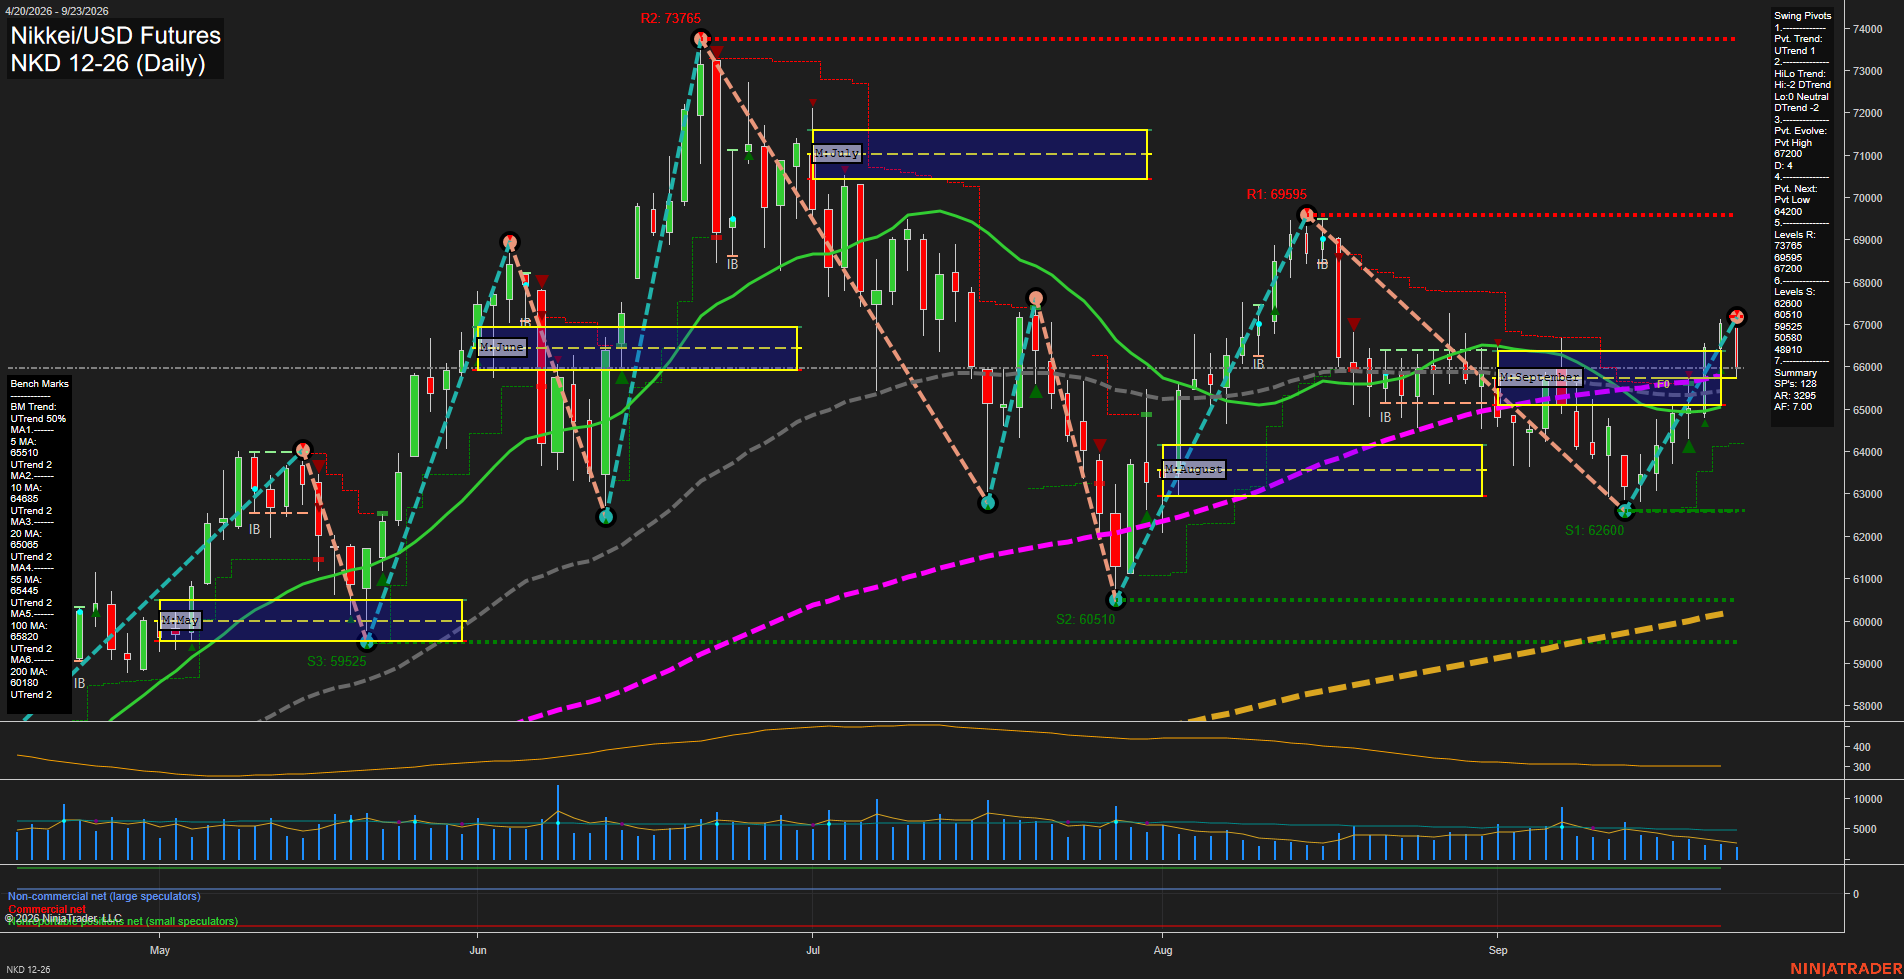
NKD Nikkei/USD Futures Daily Chart Analysis: 2026-Sep-24 07:08 CT
Price Action
- Last: 66100,
- Bars: Medium,
- Mom: Fast.
WSFG Weekly
- Short-Term
- WSFG Current: 16%
- F0%/NTZ' Bias: Price Above,
- WSFG Trend: Up.
MSFG Month Sep
- Intermediate-Term
- MSFG Current: -10%
- F0%/NTZ' Bias: Price Below,
- MSFG Trend: Down.
YSFG Year 2026
- Long-Term
- YSFG Current: 173%
- F0%/NTZ' Bias: Price Above,
- YSFG Trend: Up.
Swing Pivots
- (Short-Term) 1. Pvt. Trend: UTrend,
- (Intermediate-Term) 2. HiLo Trend: DTrend,
- 3. Pvt. Evolve: Pvt high 67200,
- 4. Pvt. Next: Pvt low 64200,
- 5. Levels R: 73765, 69595, 67200,
- 6. Levels S: 62600, 60510, 59525.
Daily Benchmarks
- (Short-Term) 5 Day: 65510 Up Trend,
- (Short-Term) 10 Day: 64685 Up Trend,
- (Intermediate-Term) 20 Day: 65600 Up Trend,
- (Intermediate-Term) 55 Day: 65445 Up Trend,
- (Long-Term) 100 Day: 63850 Up Trend,
- (Long-Term) 200 Day: 60180 Up Trend.
Additional Metrics
Recent Trade Signals
- 20 Sep 2026: Long NKD 12-26 @ 65185 Signals.USAR-WSFG
Overall Rating
- Short-Term: Bullish,
- Intermediate-Term: Neutral,
- Long-Term: Bullish.
Key Insights Summary
Price has staged a fast recovery from the 62600 swing-low area and remains above all daily benchmarks, confirming broad upside alignment. The short-term pivot structure is in an UTrend, although price is testing the 67200 pivot-high resistance after a sharp advance. The monthly grid remains below its F0% reference, creating an intermediate-term countertrend condition within the larger bullish yearly structure. Support is concentrated around the 65600 to 65445 benchmark cluster, followed by 62600; resistance is defined by 67200, then 69595. The recent rebound has strong momentum, while the DTrend HiLo structure indicates the broader swing sequence has not fully reversed.
Chart Analysis ATS AI Generated: 2026-09-24 07:08 for Informational use only, not trading advice. Terms and Risk Disclosure Copyright © 2026. Algo Trading Systems LLC.