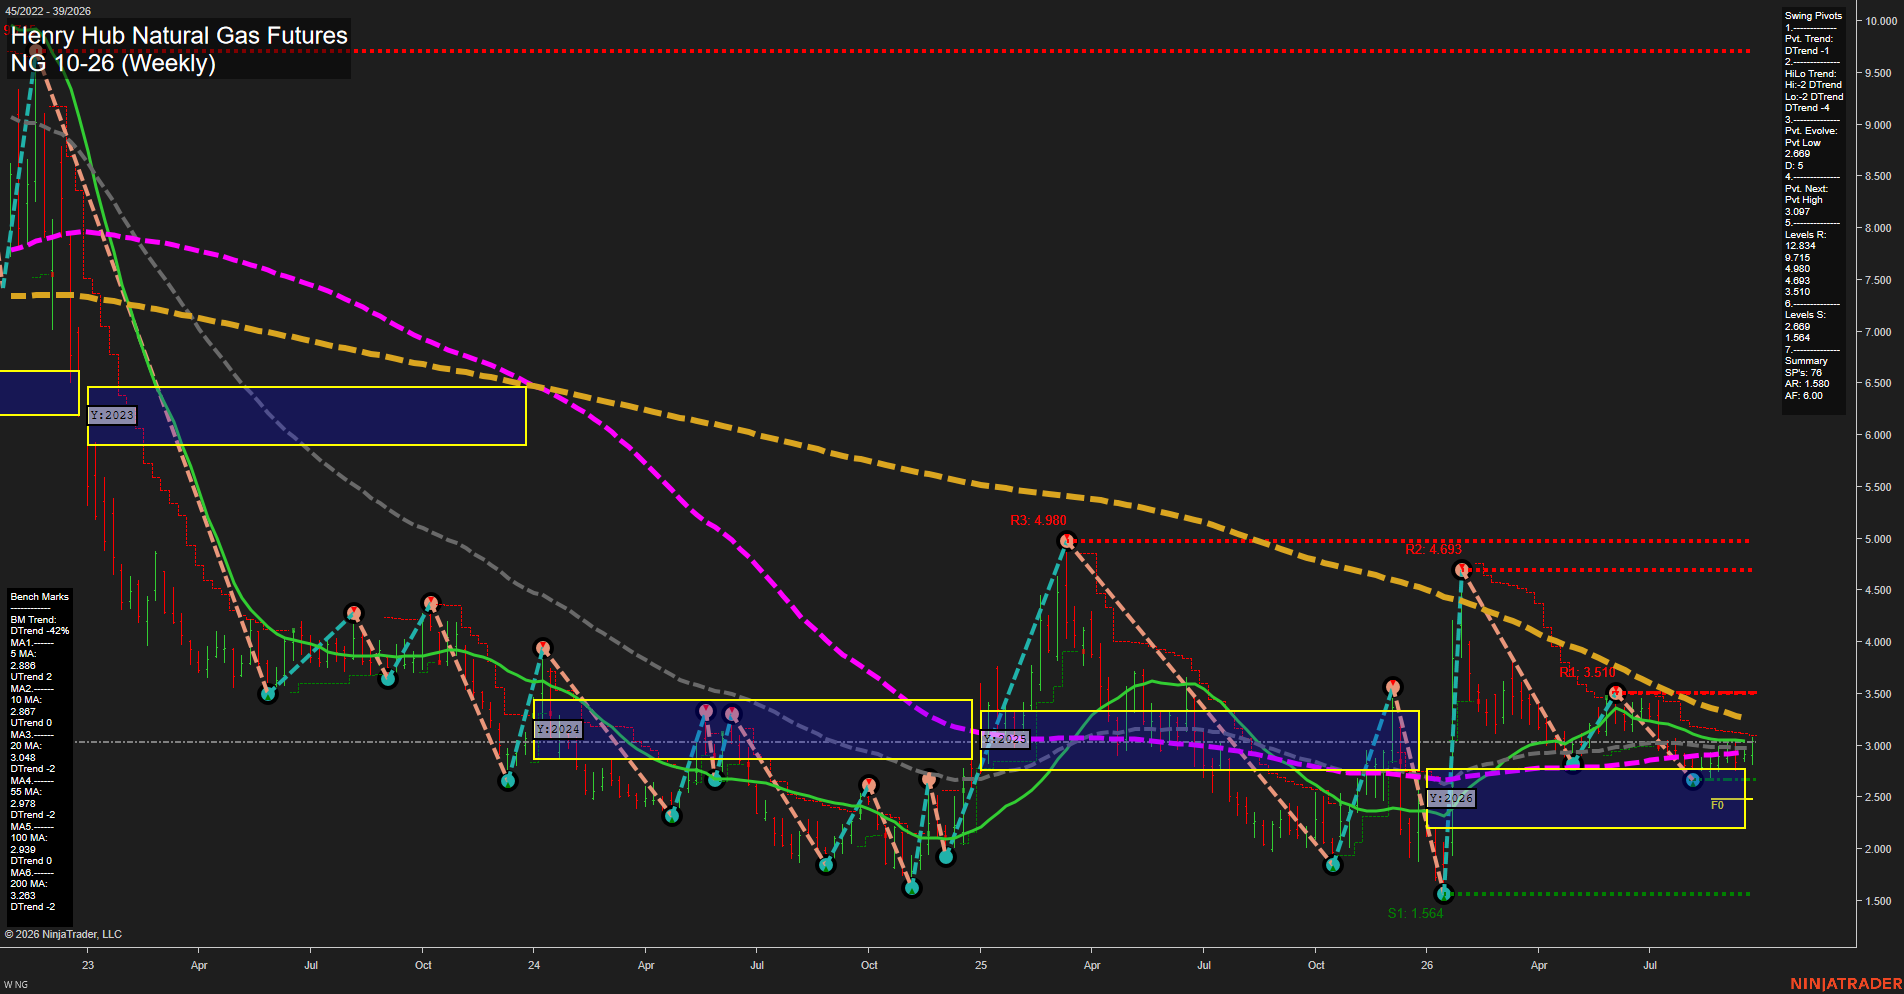
NG Henry Hub Natural Gas Futures Weekly Chart Analysis: 2026-Sep-24 07:07 CT
Price Action
- Last: 2.934,
- Bars: Small,
- Mom: Slow.
WSFG Weekly
- Short-Term
- WSFG Current: 62%
- F0%/NTZ' Bias: Price Above,
- WSFG Trend: Up.
MSFG Month Sep
- Intermediate-Term
- MSFG Current: 24%
- F0%/NTZ' Bias: Price Above,
- MSFG Trend: Up.
YSFG Year 2026
- Long-Term
- YSFG Current: 19%
- F0%/NTZ' Bias: Price Above,
- YSFG Trend: Up.
Swing Pivots
- (Short-Term) 1. Pvt. Trend: DTrend,
- (Intermediate-Term) 2. HiLo Trend: DTrend,
- 3. Pvt. Evolve: Pvt low 2.669,
- 4. Pvt. Next: Pvt high 3.097,
- 5. Levels R: 12.934, 9.715, 4.980, 4.693, 3.510,
- 6. Levels S: 2.669, 1.564.
Weekly Benchmarks
- (Short-Term) 5 Day: 2.886 Up Trend,
- (Short-Term) 10 Day: 2.867 Up Trend,
- (Intermediate-Term) 20 Day: 3.049 Down Trend,
- (Intermediate-Term) 55 Day: 2.978 Down Trend,
- (Long-Term) 100 Day: 2.939 Down Trend,
- (Long-Term) 200 Day: 3.263 Down Trend.
Overall Rating
- Short-Term: Neutral,
- Intermediate-Term: Bearish,
- Long-Term: Bearish.
Key Insights Summary
Price is holding above the weekly, monthly, and yearly F0%/NTZ structures, while the 5- and 10-week benchmarks have turned upward. However, the active pivot structure remains a short-term DTrend and the intermediate HiLo sequence is also down. The market is consolidating beneath clustered benchmark resistance around 2.939-3.049, with 3.097 the next pivot reversal threshold and 3.510 the first larger swing resistance. Support is defined by the evolving 2.669 pivot low, followed by major support at 1.564. Small weekly bars and slow momentum reflect compression following the recovery from the early-2026 low, while the declining 20-, 55-, 100-, and 200-week averages retain a broader bearish trend backdrop.
Chart Analysis ATS AI Generated: 2026-09-24 07:08 for Informational use only, not trading advice. Terms and Risk Disclosure Copyright © 2026. Algo Trading Systems LLC.