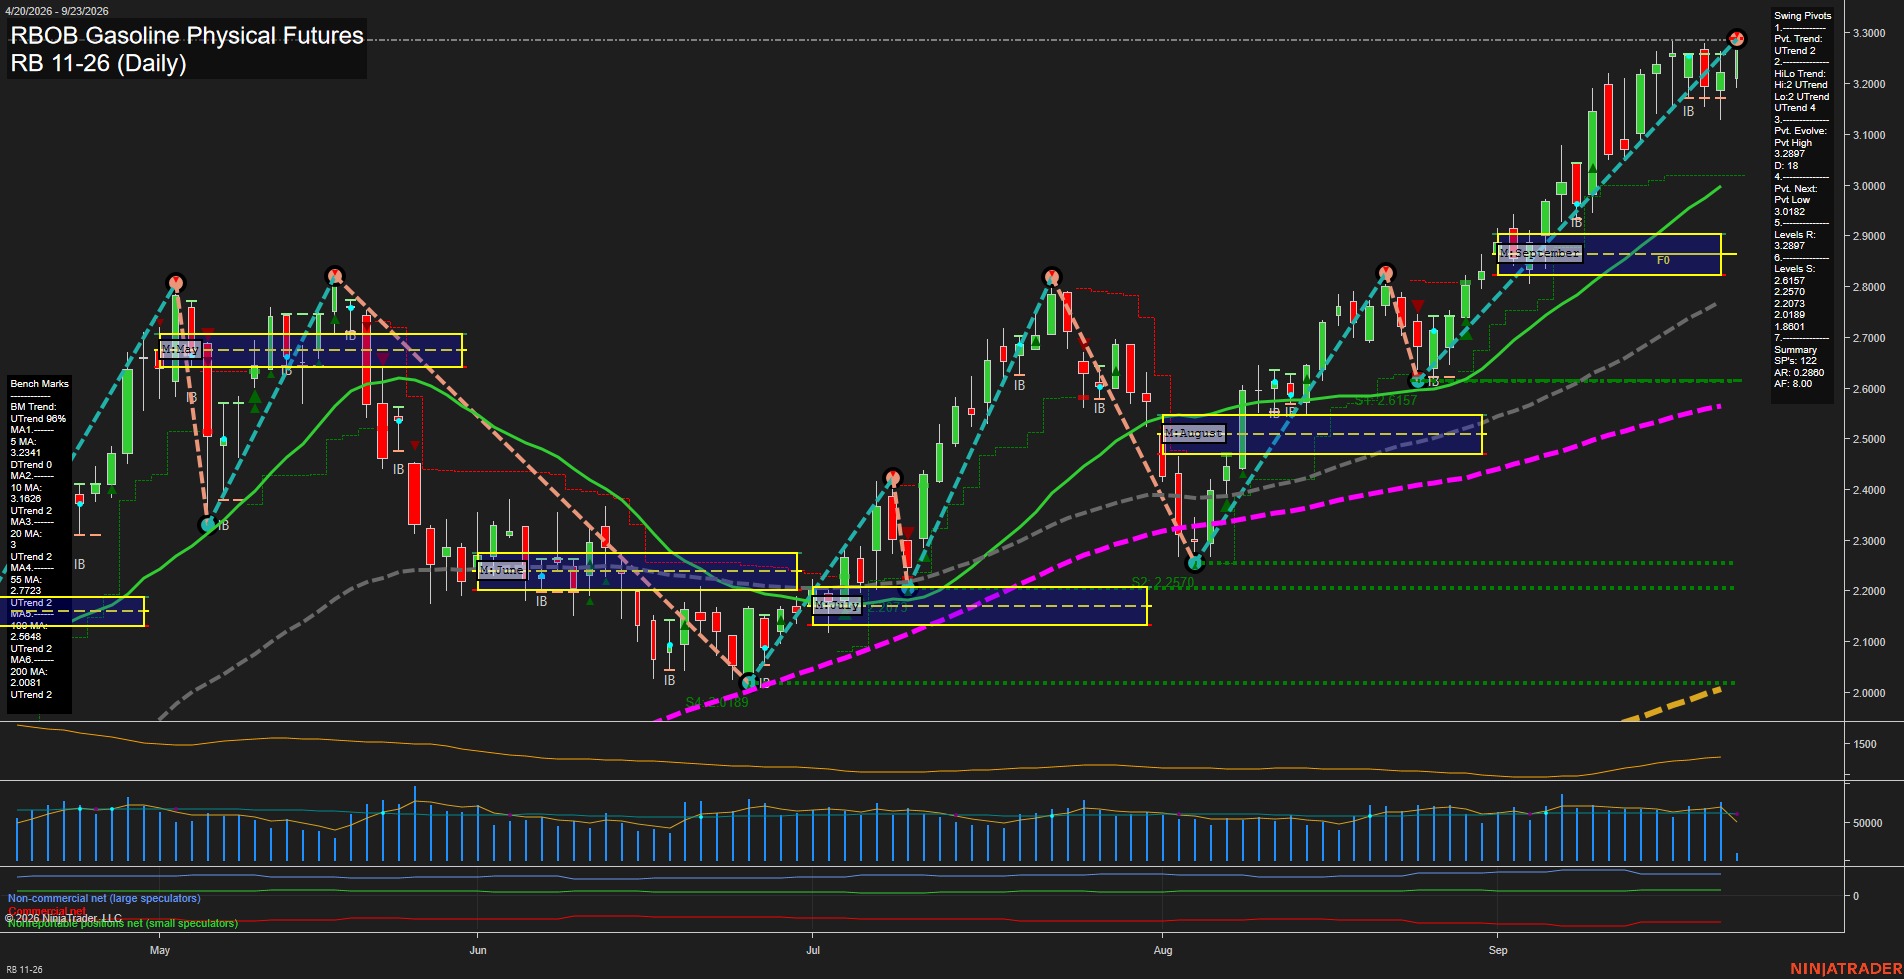
RB RBOB Gasoline Physical Futures Daily Chart Analysis: 2026-Sep-23 07:10 CT
Price Action
- Last: 3.2871,
- Bars: Small,
- Mom: Fast.
WSFG Weekly
- Short-Term
- WSFG Current: 12%
- F0%/NTZ' Bias: Price Above,
- WSFG Trend: Up.
MSFG Month Sep
- Intermediate-Term
- MSFG Current: 86%
- F0%/NTZ' Bias: Price Above,
- MSFG Trend: Up.
YSFG Year 2026
- Long-Term
- YSFG Current: 240%
- F0%/NTZ' Bias: Price Above,
- YSFG Trend: Up.
Swing Pivots
- (Short-Term) 1. Pvt. Trend: UTrend,
- (Intermediate-Term) 2. HiLo Trend: UTrend,
- 3. Pvt. Evolve: Pvt high 3.2897,
- 4. Pvt. Next: Pvt low 3.0182,
- 5. Levels R: 3.2897,
- 6. Levels S: 2.6157, 2.2570, 2.2073, 2.0189, 1.8601.
Daily Benchmarks
- (Short-Term) 5 Day: 3.2341 Up Trend,
- (Short-Term) 10 Day: 3.1626 Up Trend,
- (Intermediate-Term) 20 Day: 3.0010 Up Trend,
- (Intermediate-Term) 55 Day: 2.7723 Up Trend,
- (Long-Term) 100 Day: 2.5252 Up Trend,
- (Long-Term) 200 Day: 2.0081 Up Trend.
Additional Metrics
Recent Trade Signals
- 23 Sep 2026: Long RB 11-26 @ 3.2937 Signals.USAR-WSFG
- 17 Sep 2026: Short RB 10-26 @ 3.406 Signals.USAR.TR120
Overall Rating
- Short-Term: Bullish,
- Intermediate-Term: Bullish,
- Long-Term: Bullish.
Key Insights Summary
Price remains in a broad daily advance with higher swing highs and higher swing lows, trading above every benchmark average and above the monthly and yearly F0%/NTZ structures. The short-term swing has accelerated into the 3.2897 pivot-high resistance area, where recent small candles indicate consolidation after a steep rally rather than a confirmed trend reversal. The 3.0182 pivot-low threshold defines the current short-term structural reversal level, while 2.6157 is the principal lower swing-support reference. Rising ATR and active volume conditions reflect expanded daily range and sustained momentum as the market tests the upper end of its recent price cycle.
Chart Analysis ATS AI Generated: 2026-09-23 07:10 for Informational use only, not trading advice. Terms and Risk Disclosure Copyright © 2026. Algo Trading Systems LLC.