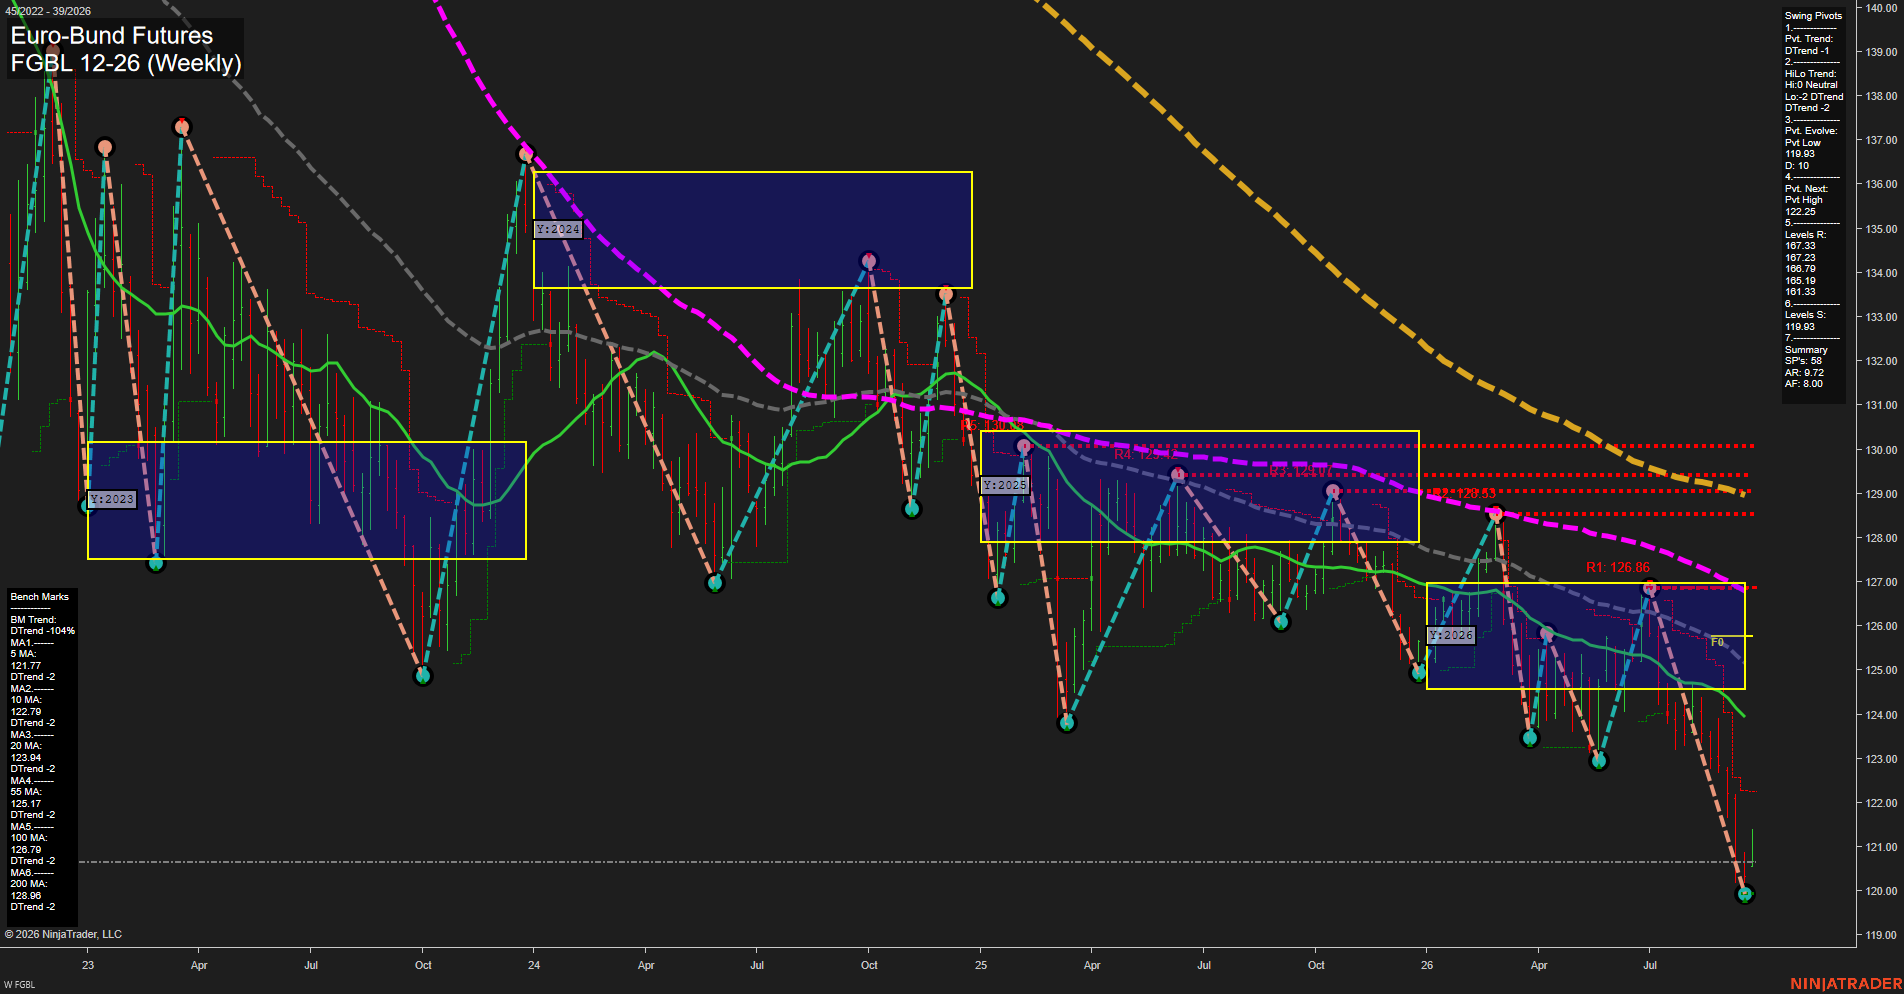
FGBL Euro-Bund Futures Weekly Chart Analysis: 2026-Sep-23 07:06 CT
Price Action
- Last: 119.93,
- Bars: Large,
- Mom: Momentum fast.
WSFG Weekly
- Short-Term
- WSFG Current: 15%
- F0%/NTZ' Bias: Price Above,
- WSFG Trend: Up.
MSFG Month Sep
- Intermediate-Term
- MSFG Current: -61%
- F0%/NTZ' Bias: Price Below,
- MSFG Trend: Down.
YSFG Year 2026
- Long-Term
- YSFG Current: -42%
- F0%/NTZ' Bias: Price Below,
- YSFG Trend: Down.
Swing Pivots
- (Short-Term) 1. Pvt. Trend: DTrend,
- (Intermediate-Term) 2. HiLo Trend: DTrend,
- 3. Pvt. Evolve: Pvt low 119.93,
- 4. Pvt. Next: Pvt high 122.25,
- 5. Levels R: 167.33, 167.23, 166.79, 161.79, 161.33,
- 6. Levels S: 119.93, 117.99.
Weekly Benchmarks
- (Short-Term) 5 Day: 121.77 Down Trend,
- (Short-Term) 10 Day: 122.79 Down Trend,
- (Intermediate-Term) 20 Day: 123.94 Down Trend,
- (Intermediate-Term) 55 Day: 125.17 Down Trend,
- (Long-Term) 100 Day: 126.79 Down Trend,
- (Long-Term) 200 Day: 128.06 Down Trend.
Recent Trade Signals
- 21 Sep 2026: Long FGBL 12-26 @ 120.86 Signals.USAR-WSFG
- 17 Sep 2026: Long FGBL 12-26 @ 120.83 Signals.USAR.TR120
Overall Rating
- Short-Term: Bearish,
- Intermediate-Term: Bearish,
- Long-Term: Bearish.
Key Insights Summary
Price has broken sharply below the recent 2026 range and the 120.83-120.86 long-signal area, producing a fast, large-bar selloff into the active 119.93 pivot low. Pivot structure remains bearish, with lower highs and lower lows, while all six weekly benchmarks are declining and positioned above price. The weekly Fib grid remains marginally positive, but this is counter to the decisive monthly and yearly bearish grids. A reversal pivot requires recovery through 122.25; until then, 119.93 is the immediate structural support, with 117.99 the next lower pivot reference.
Chart Analysis ATS AI Generated: 2026-09-23 07:07 for Informational use only, not trading advice. Terms and Risk Disclosure Copyright © 2026. Algo Trading Systems LLC.