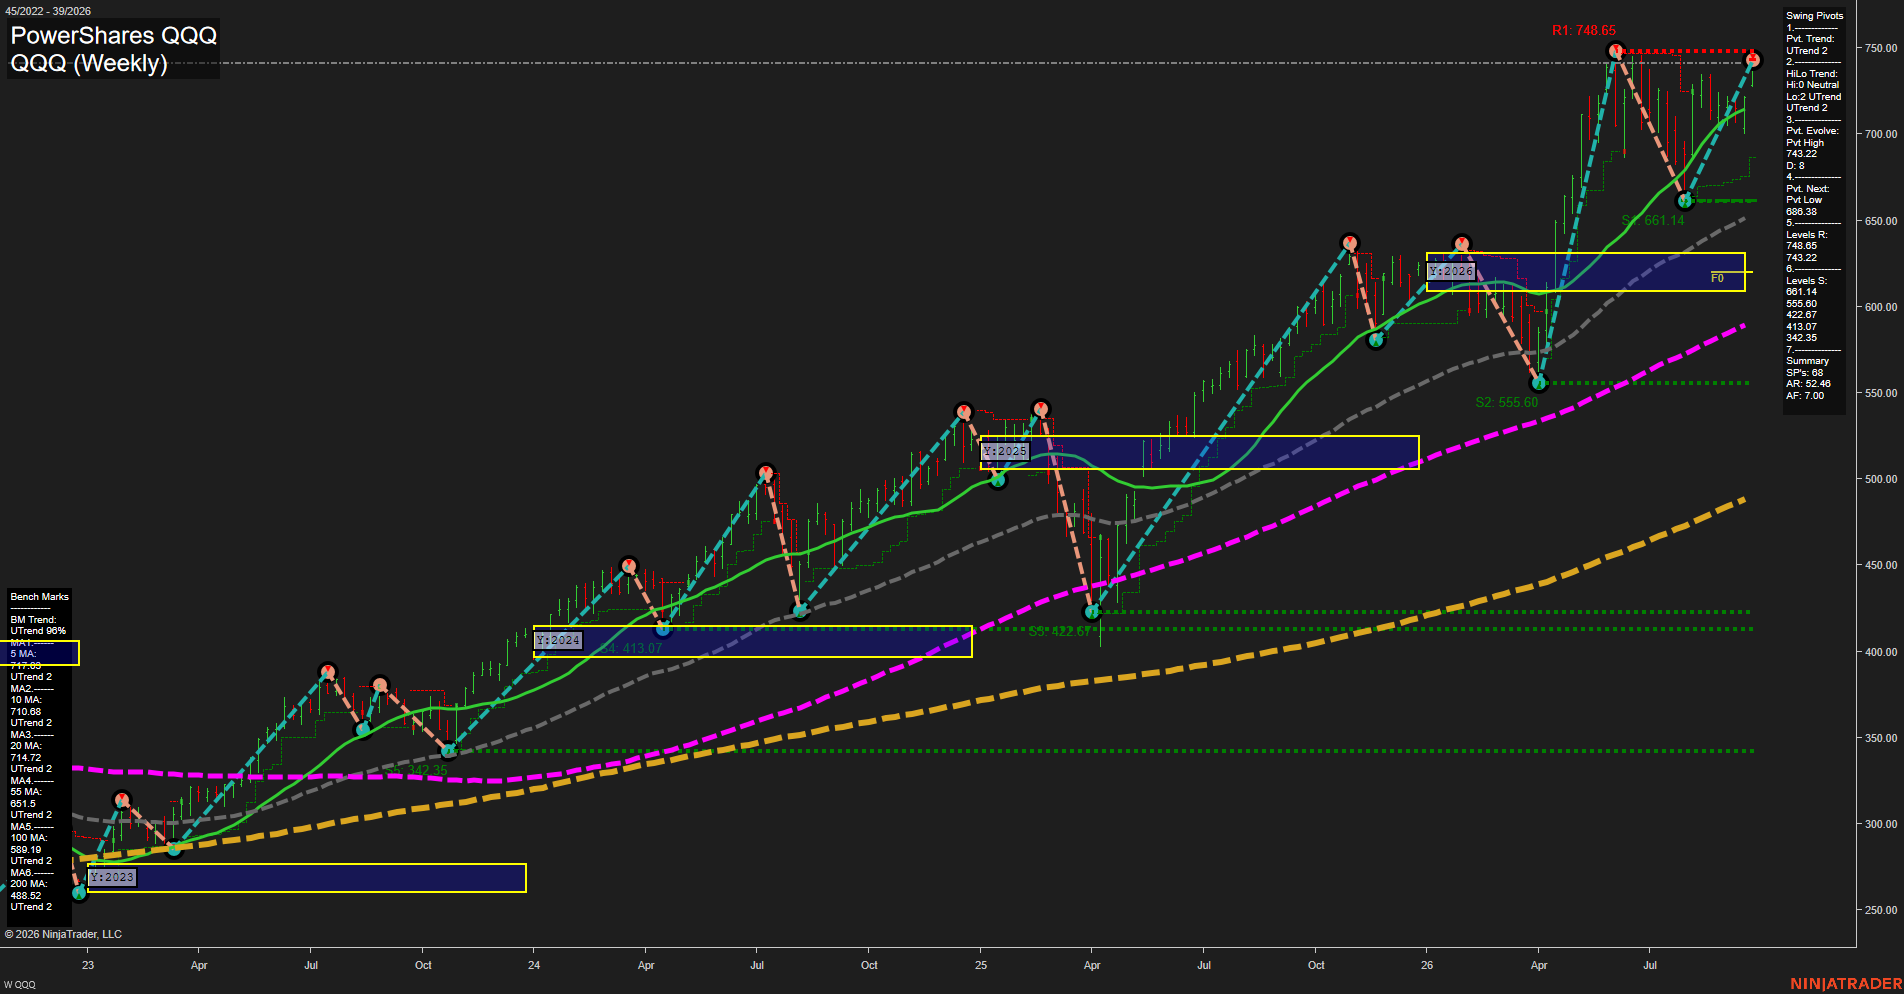
QQQ PowerShares QQQ Weekly Chart Analysis: 2026-Sep-22 07:11 CT
Price Action
- Last: 743.22,
- Bars: Medium,
- Mom: fast.
WSFG Weekly
- Short-Term
- WSFG Current: NA%
- F0%/NTZ' Bias: Price Above NTZ,
- WSFG Trend: Bullish.
MSFG Month Sep
- Intermediate-Term
- MSFG Current: NA%
- F0%/NTZ' Bias: Price Above NTZ,
- MSFG Trend: Bullish.
YSFG Year 2026
- Long-Term
- YSFG Current: NA%
- F0%/NTZ' Bias: Price Above NTZ,
- YSFG Trend: Bullish.
Swing Pivots
- (Short-Term) 1. Pvt. Trend: UTrend,
- (Intermediate-Term) 2. HiLo Trend: UTrend,
- 3. Pvt. Evolve: Pvt high 743.22,
- 4. Pvt. Next: Pvt low 686.38,
- 5. Levels R: 748.65, 743.22,
- 6. Levels S: 681.14, 555.60, 422.67, 413.07, 342.35.
Weekly Benchmarks
- (Short-Term) 5 Day: 714.72 Up Trend,
- (Short-Term) 10 Day: 710.68 Up Trend,
- (Intermediate-Term) 20 Day: 714.72 Up Trend,
- (Intermediate-Term) 55 Day: 651.15 Up Trend,
- (Long-Term) 100 Day: 589.19 Up Trend,
- (Long-Term) 200 Day: 488.02 Up Trend.
Overall Rating
- Short-Term: Bullish,
- Intermediate-Term: Bullish,
- Long-Term: Bullish.
Key Insights Summary
QQQ, a liquid proxy for Nasdaq futures participation, remains in a strong multi-timeframe expansion phase. Weekly price is pressing the 743.22 to 748.65 pivot-high resistance band after a sharp V-shaped recovery from the 555.60 support region. The short-term pivot structure remains upward, although the active pivot is a high and price is testing the prior extreme rather than trading in open space. All benchmark averages are rising and stacked well below price, confirming broad intermediate- and long-term trend sponsorship. From a futures swing-trader perspective, the dominant theme is trend continuation with elevated momentum; 686.38 is the nearest structural pivot-low reference, while 748.65 defines the immediate breakout or rejection boundary.
Chart Analysis ATS AI Generated: 2026-09-22 07:11 for Informational use only, not trading advice. Terms and Risk Disclosure Copyright © 2026. Algo Trading Systems LLC.