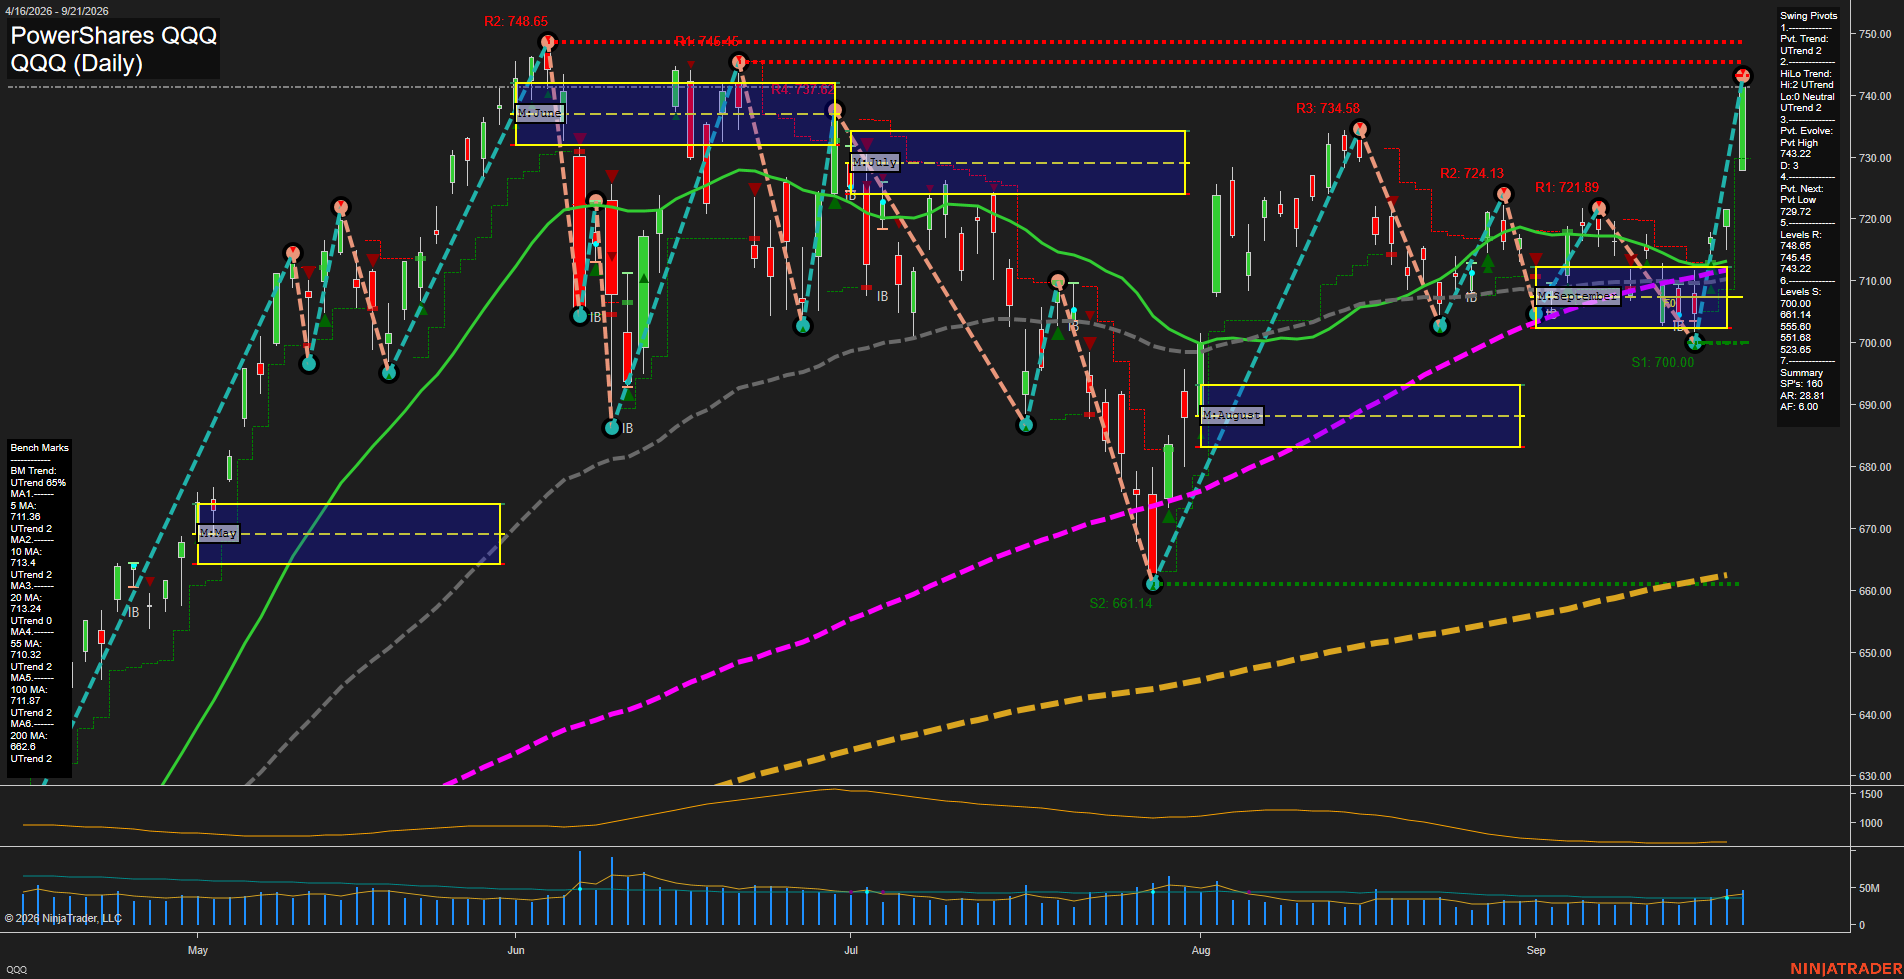
QQQ PowerShares QQQ Daily Chart Analysis: 2026-Sep-22 07:11 CT
Price Action
- Last: 729.72,
- Bars: Large,
- Mom: fast.
WSFG Weekly
- Short-Term
- WSFG Current: 100%
- F0%/NTZ' Bias: Price Bullish,
- WSFG Trend: Bullish.
MSFG Month Sep
- Intermediate-Term
- MSFG Current: 100%
- F0%/NTZ' Bias: Price Bullish,
- MSFG Trend: Bullish.
YSFG Year 2026
- Long-Term
- YSFG Current: 100%
- F0%/NTZ' Bias: Price Bullish,
- YSFG Trend: Bullish.
Swing Pivots
- (Short-Term) 1. Pvt. Trend: UTrend,
- (Intermediate-Term) 2. HiLo Trend: UTrend,
- 3. Pvt. Evolve: Pvt high 743.20,
- 4. Pvt. Next: Pvt low 729.72,
- 5. Levels R: 748.65, 745.45, 743.22,
- 6. Levels S: 700.00, 661.14, 555.60, 551.68, 528.55.
Daily Benchmarks
- (Short-Term) 5 Day: 711.38 Up Trend,
- (Short-Term) 10 Day: 713.40 Up Trend,
- (Intermediate-Term) 20 Day: 715.24 Up Trend,
- (Intermediate-Term) 55 Day: 710.32 Up Trend,
- (Long-Term) 100 Day: 711.87 Up Trend,
- (Long-Term) 200 Day: 662.60 Up Trend.
Additional Metrics
- ATR: 28.81,
- VOLMA: 32709273.
Overall Rating
- Short-Term: Bullish,
- Intermediate-Term: Bullish,
- Long-Term: Bullish.
Key Insights Summary
QQQ reflects a strong upside impulse from the September 700.00 swing-low area, with large-range bars and fast momentum carrying price above all daily benchmark averages. From a futures swing-trader perspective, the corresponding Nasdaq index-futures structure is a bullish trend-continuation phase, although price is now pressing into the 743.22 to 748.65 overhead pivot-resistance band after a nearly vertical recovery. The short-term pivot remains an UTrend and the intermediate HiLo structure is also an UTrend; 729.72 defines the current pivot-reversal reference, while 700.00 remains the major nearby structural support. Volume is improving with the advance, while the elevated 28.81 ATR indicates broad daily rotation and an expanded futures-equivalent range.
Chart Analysis ATS AI Generated: 2026-09-22 07:11 for Informational use only, not trading advice. Terms and Risk Disclosure Copyright © 2026. Algo Trading Systems LLC.