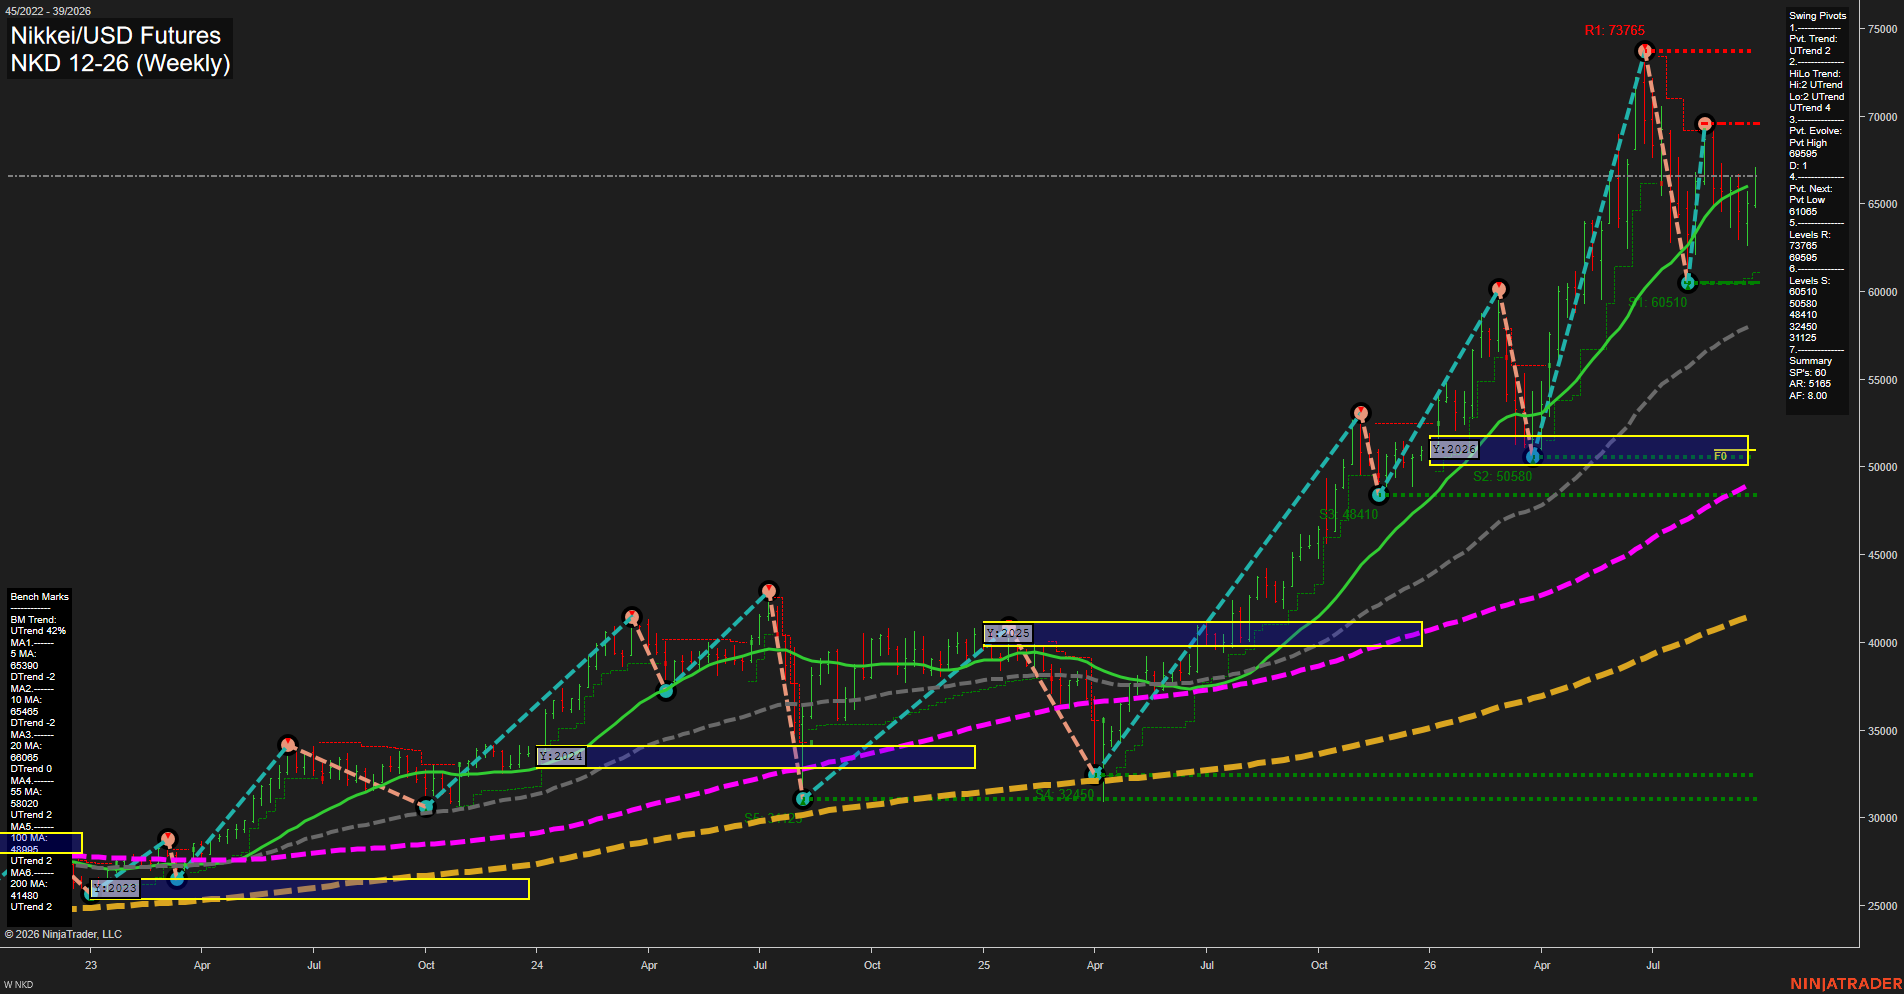
NKD Nikkei/USD Futures Weekly Chart Analysis: 2026-Sep-22 07:09 CT
Price Action
- Last: 66595,
- Bars: Large,
- Mom: average.
WSFG Weekly
- Short-Term
- WSFG Current: 51%
- F0%/NTZ' Bias: Price Above,
- WSFG Trend: Up.
MSFG Month Sep
- Intermediate-Term
- MSFG Current: 4%
- F0%/NTZ' Bias: Price Above,
- MSFG Trend: Up.
YSFG Year 2026
- Long-Term
- YSFG Current: 187%
- F0%/NTZ' Bias: Price Above,
- YSFG Trend: Up.
Swing Pivots
- (Short-Term) 1. Pvt. Trend: UTrend,
- (Intermediate-Term) 2. HiLo Trend: UTrend,
- 3. Pvt. Evolve: Pvt high 68995,
- 4. Pvt. Next: Pvt low 61085,
- 5. Levels R: 73765, 69995,
- 6. Levels S: 61050, 50580, 48410, 32450, 31125, 30835.
Weekly Benchmarks
- (Short-Term) 5 Day: 65390 Down Trend,
- (Short-Term) 10 Day: 65485 Down Trend,
- (Intermediate-Term) 20 Day: 66085 Down Trend,
- (Intermediate-Term) 55 Day: 58020 Up Trend,
- (Long-Term) 100 Day: 48995 Up Trend,
- (Long-Term) 200 Day: 41180 Up Trend.
Recent Trade Signals
- 20 Sep 2026: Long NKD 12-26 @ 65185 Signals.USAR-WSFG
Overall Rating
- Short-Term: Bullish,
- Intermediate-Term: Bullish,
- Long-Term: Bullish.
Key Insights Summary
The weekly structure remains broadly bullish, with price above the weekly, monthly, and yearly F0% levels and well above the rising 55, 100, and 200 period benchmarks. The recent recovery from the 61050 support area restored the short-term UTrend, although the evolving 68995 pivot high and declining 5, 10, and 20 period averages show near-term consolidation following an exceptionally volatile rally. The 69995 pivot resistance is the immediate overhead reference, followed by 73765, while 61050 is the primary structural support separating the current higher-low pattern from a deeper retracement.
Chart Analysis ATS AI Generated: 2026-09-22 07:09 for Informational use only, not trading advice. Terms and Risk Disclosure Copyright © 2026. Algo Trading Systems LLC.