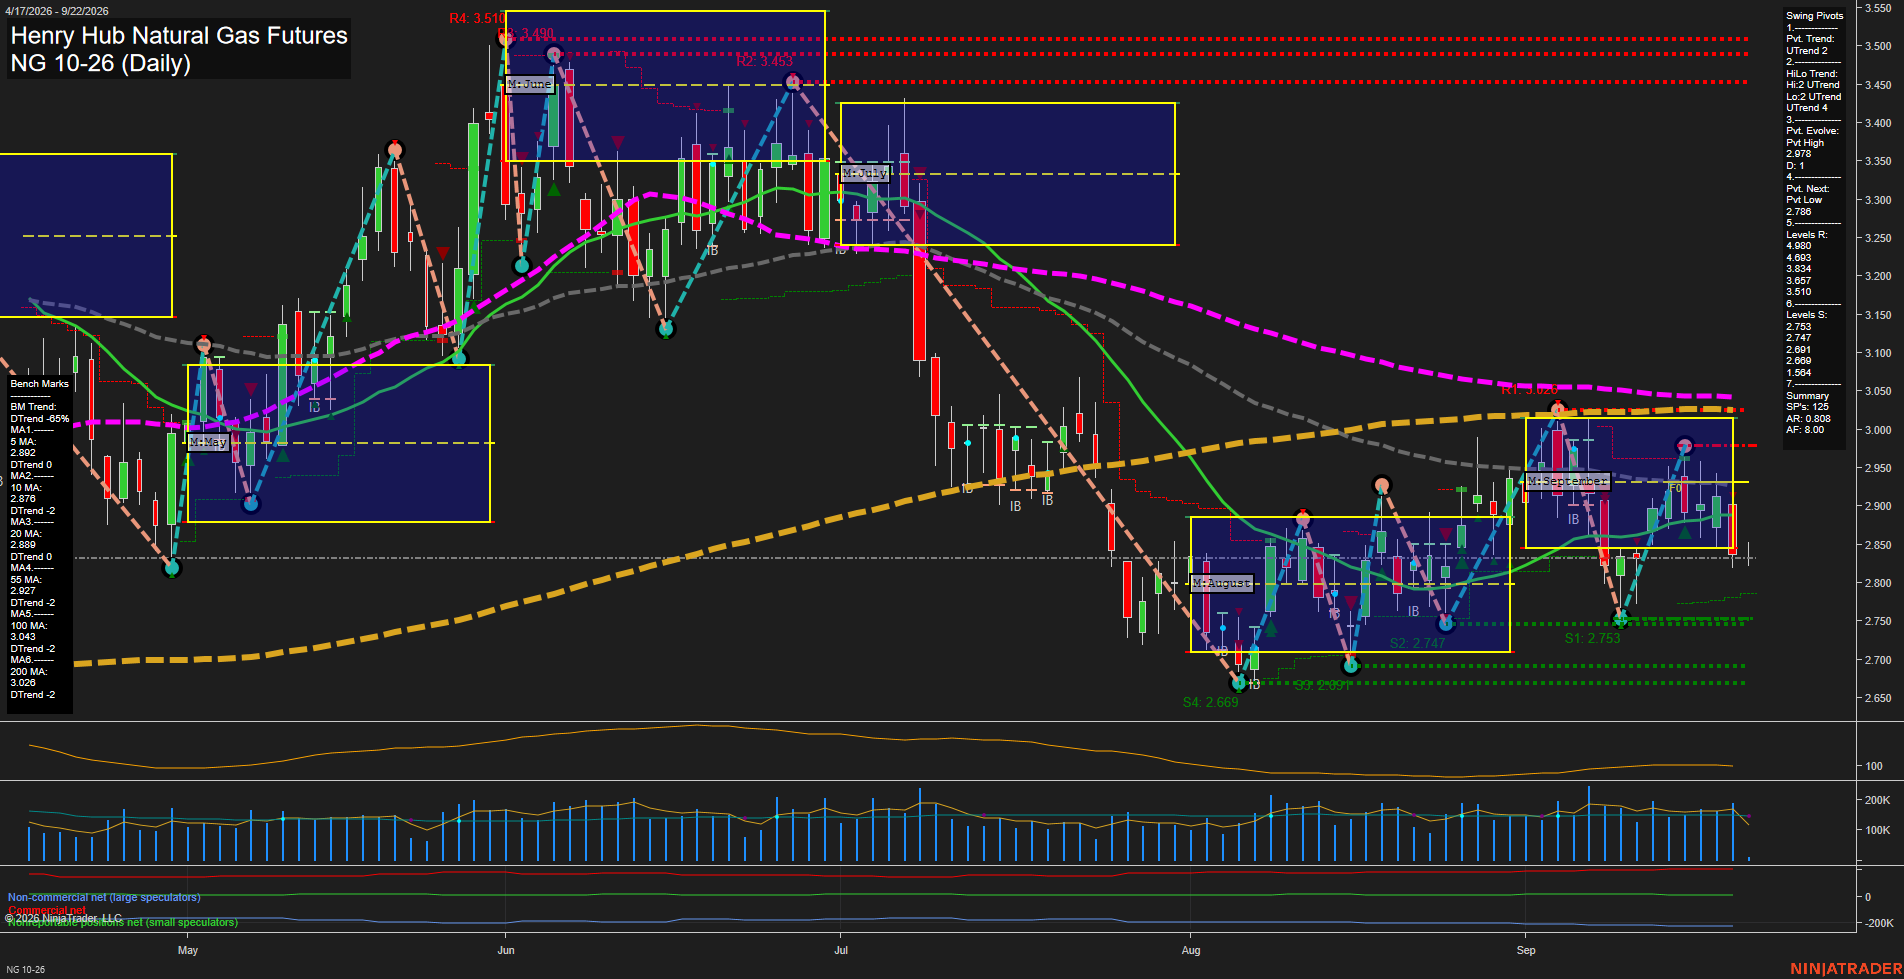
NG Henry Hub Natural Gas Futures Daily Chart Analysis: 2026-Sep-22 07:08 CT
Price Action
- Last: 2.851,
- Bars: Small,
- Mom: Slow.
WSFG Weekly
- Short-Term
- WSFG Current: -38%
- F0%/NTZ' Bias: Price Below,
- WSFG Trend: Down.
MSFG Month Sep
- Intermediate-Term
- MSFG Current: -21%
- F0%/NTZ' Bias: Price Below,
- MSFG Trend: Down.
YSFG Year 2026
- Long-Term
- YSFG Current: 12%
- F0%/NTZ' Bias: Price Above,
- YSFG Trend: Up.
Swing Pivots
- (Short-Term) 1. Pvt. Trend: UTrend,
- (Intermediate-Term) 2. HiLo Trend: UTrend,
- 3. Pvt. Evolve: Pvt high 2.978,
- 4. Pvt. Next: Pvt low 2.786,
- 5. Levels R: 4.898, 4.693, 3.834, 3.697, 3.510,
- 6. Levels S: 2.753, 2.747, 2.689, 2.669.
Daily Benchmarks
- (Short-Term) 5 Day: 2.892 Down Trend,
- (Short-Term) 10 Day: 2.876 Down Trend,
- (Intermediate-Term) 20 Day: 2.880 Down Trend,
- (Intermediate-Term) 55 Day: 2.927 Down Trend,
- (Long-Term) 100 Day: 3.047 Down Trend,
- (Long-Term) 200 Day: 3.026 Down Trend.
Additional Metrics
Recent Trade Signals
- 21 Sep 2026: Short NG 10-26 @ 2.831 Signals.USAR.TR120
Overall Rating
- Short-Term: Bearish,
- Intermediate-Term: Bearish,
- Long-Term: Bearish.
Key Insights Summary
Price is consolidating below the September F0% area and beneath every daily benchmark, leaving the broader swing structure bearishly aligned despite the active short-term UTrend pivot sequence. The recent bounce from the 2.75 support cluster produced a higher low, but momentum has slowed below the 2.88 to 2.93 moving-average band and beneath the 2.978 pivot high. This reflects a choppy countertrend recovery within the larger decline from the June and July highs. The 2.753 to 2.669 support zone remains the principal lower structure, while the nearby benchmark cluster and the 2.978 pivot high define the overhead rebound ceiling.
Chart Analysis ATS AI Generated: 2026-09-22 07:09 for Informational use only, not trading advice. Terms and Risk Disclosure Copyright © 2026. Algo Trading Systems LLC.