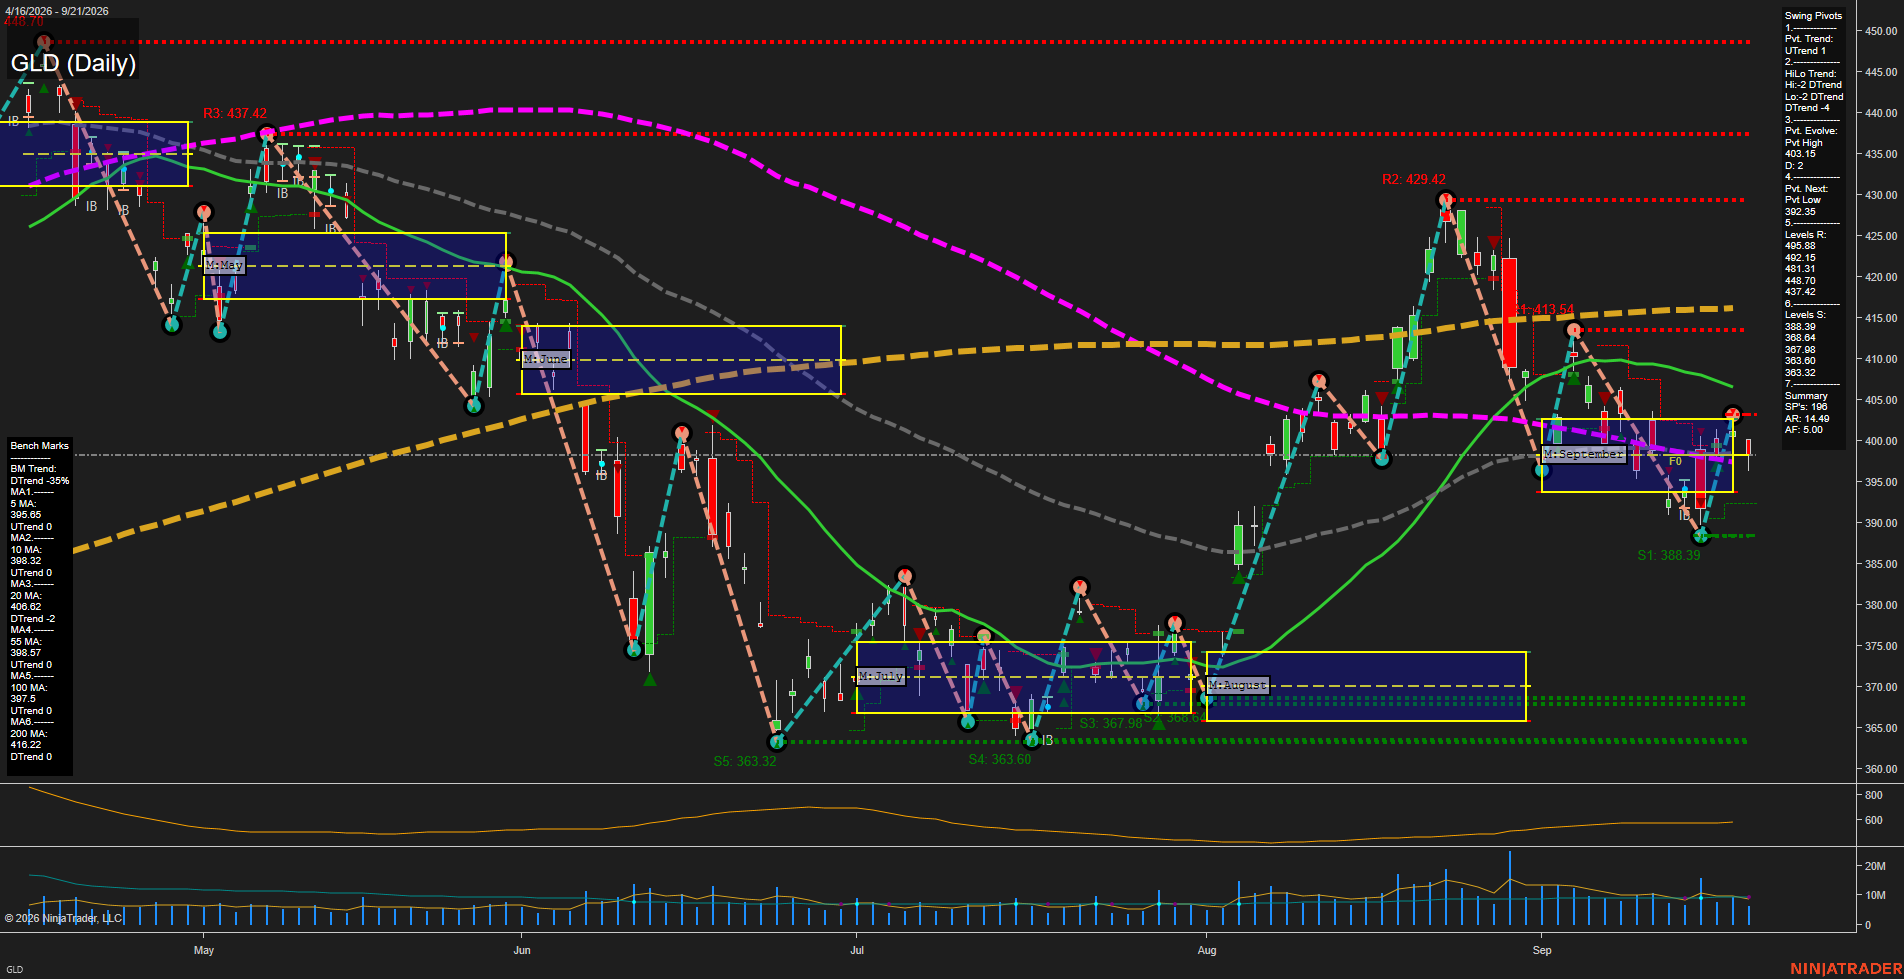
GLD SPDR Gold Shares Daily Chart Analysis: 2026-Sep-22 07:08 CT
Price Action
- Last: 398.09,
- Bars: Medium,
- Mom: Average.
WSFG Weekly
- Short-Term
- WSFG Current: NA%
- F0%/NTZ' Bias: Price Neutral,
- WSFG Trend: Neutral.
MSFG Month Sep
- Intermediate-Term
- MSFG Current: 0%
- F0%/NTZ' Bias: Price Neutral,
- MSFG Trend: Neutral.
YSFG Year 2026
- Long-Term
- YSFG Current: NA%
- F0%/NTZ' Bias: Price Neutral,
- YSFG Trend: Neutral.
Swing Pivots
- (Short-Term) 1. Pvt. Trend: UTrend,
- (Intermediate-Term) 2. HiLo Trend: DTrend,
- 3. Pvt. Evolve: Pvt high 403.15,
- 4. Pvt. Next: Pvt low 392.35,
- 5. Levels R: 495.88, 492.15, 481.31, 438.70, 437.42,
- 6. Levels S: 388.39, 386.84, 367.98, 363.60, 363.32.
Daily Benchmarks
- (Short-Term) 5 Day: 395.65 Up Trend,
- (Short-Term) 10 Day: 398.32 Up Trend,
- (Intermediate-Term) 20 Day: 406.82 Down Trend,
- (Intermediate-Term) 55 Day: 398.57 Up Trend,
- (Long-Term) 100 Day: 397.58 Up Trend,
- (Long-Term) 200 Day: 416.22 Down Trend.
Additional Metrics
- ATR: 14.49,
- VOLMA: 7207880.
Overall Rating
- Short-Term: Neutral,
- Intermediate-Term: Bearish,
- Long-Term: Bearish.
Key Insights Summary
GLD is consolidating near the September MSFG F0% area around 398 following a sharp retracement from the 429.42 swing high. From a futures swing perspective, the short-term pivot structure has turned upward from 388.39 support, but the intermediate pivot structure remains a downtrend and price remains beneath the declining 20-day average at 406.82. The 388.39 to 403.15 range defines the current compression zone, with 392.35 marking the next pivot-reversal reference. The broader structure remains capped by 416.22 and the larger resistance cluster above 437, while the 363.32 to 367.98 support zone remains the major base established during the summer consolidation.
Chart Analysis ATS AI Generated: 2026-09-22 07:08 for Informational use only, not trading advice. Terms and Risk Disclosure Copyright © 2026. Algo Trading Systems LLC.