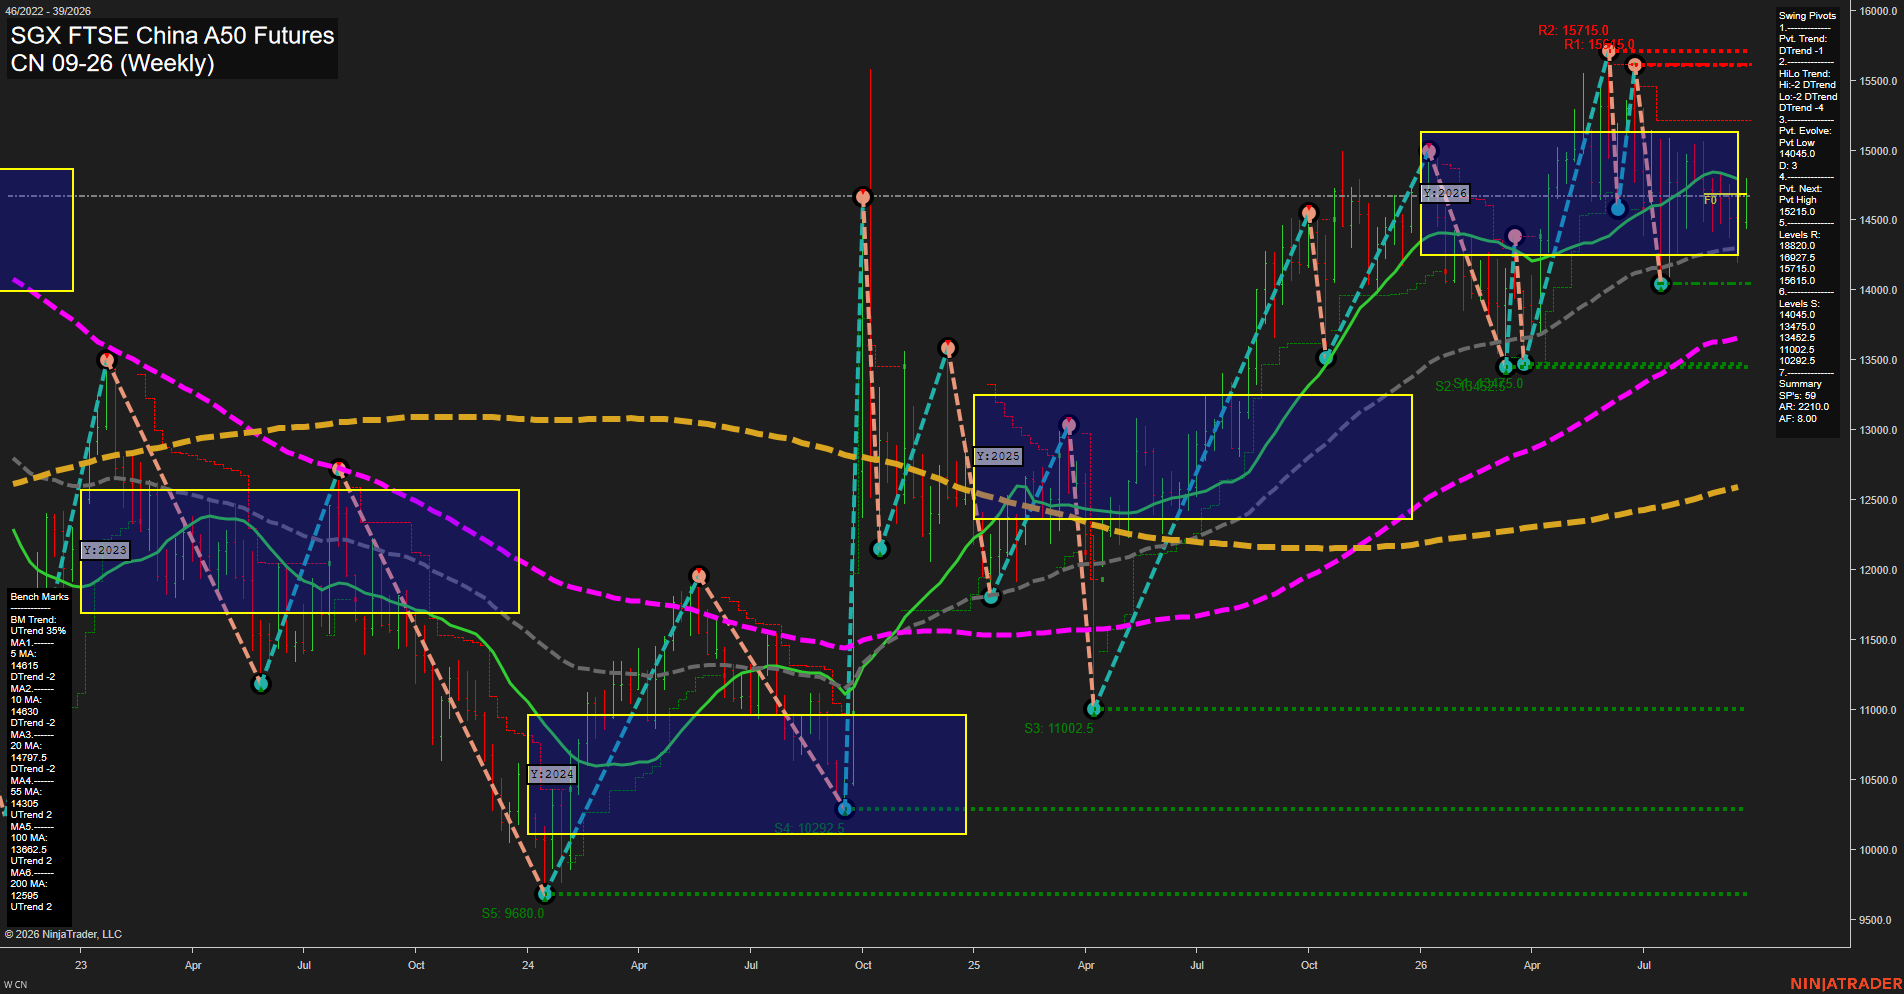
CN SGX FTSE China A50 Futures Weekly Chart Analysis: 2026-Sep-22 07:04 CT
Price Action
- Last: 14702.6,
- Bars: Medium,
- Mom: Momentum slow.
WSFG Weekly
- Short-Term
- WSFG Current: NA%
- F0%/NTZ' Bias: Price Neutral,
- WSFG Trend: Neutral.
MSFG Month Sep
- Intermediate-Term
- MSFG Current: NA%
- F0%/NTZ' Bias: Price Neutral,
- MSFG Trend: Neutral.
YSFG Year 2026
- Long-Term
- YSFG Current: 0%
- F0%/NTZ' Bias: Price Neutral,
- YSFG Trend: Neutral.
Swing Pivots
- (Short-Term) 1. Pvt. Trend: DTrend,
- (Intermediate-Term) 2. HiLo Trend: DTrend,
- 3. Pvt. Evolve: Pvt low 14045.0,
- 4. Pvt. Next: Pvt high 15125.0,
- 5. Levels R: 16927.5, 15820.0, 15715.0, 15615.0,
- 6. Levels S: 14045.0, 13475.0, 13452.5, 11002.5, 10292.5.
Weekly Benchmarks
- (Short-Term) 5 Day: 14615 Down Trend,
- (Short-Term) 10 Day: 14630 Down Trend,
- (Intermediate-Term) 20 Day: 14797.5 Down Trend,
- (Intermediate-Term) 55 Day: 14305 Up Trend,
- (Long-Term) 100 Day: 13682.5 Up Trend,
- (Long-Term) 200 Day: 12585 Up Trend.
Overall Rating
- Short-Term: Bearish,
- Intermediate-Term: Neutral,
- Long-Term: Bullish.
Key Insights Summary
Price is consolidating around the 2026 yearly F0% level at 14702.6 after a sharp recovery from the 14045 pivot low and rejection beneath the 15125 reversal threshold. The short-term pivot and HiLo structures remain in DTrend, while declining 5, 10, and 20-period benchmarks describe near-term corrective pressure. The 55, 100, and 200-period benchmarks remain upward sloping and well below price, preserving the larger recovery structure. The current weekly range is rotational and choppy between 14045 support and the 15125 pivot threshold, with 15615-15820 forming the principal overhead resistance band.
Chart Analysis ATS AI Generated: 2026-09-22 07:04 for Informational use only, not trading advice. Terms and Risk Disclosure Copyright © 2026. Algo Trading Systems LLC.