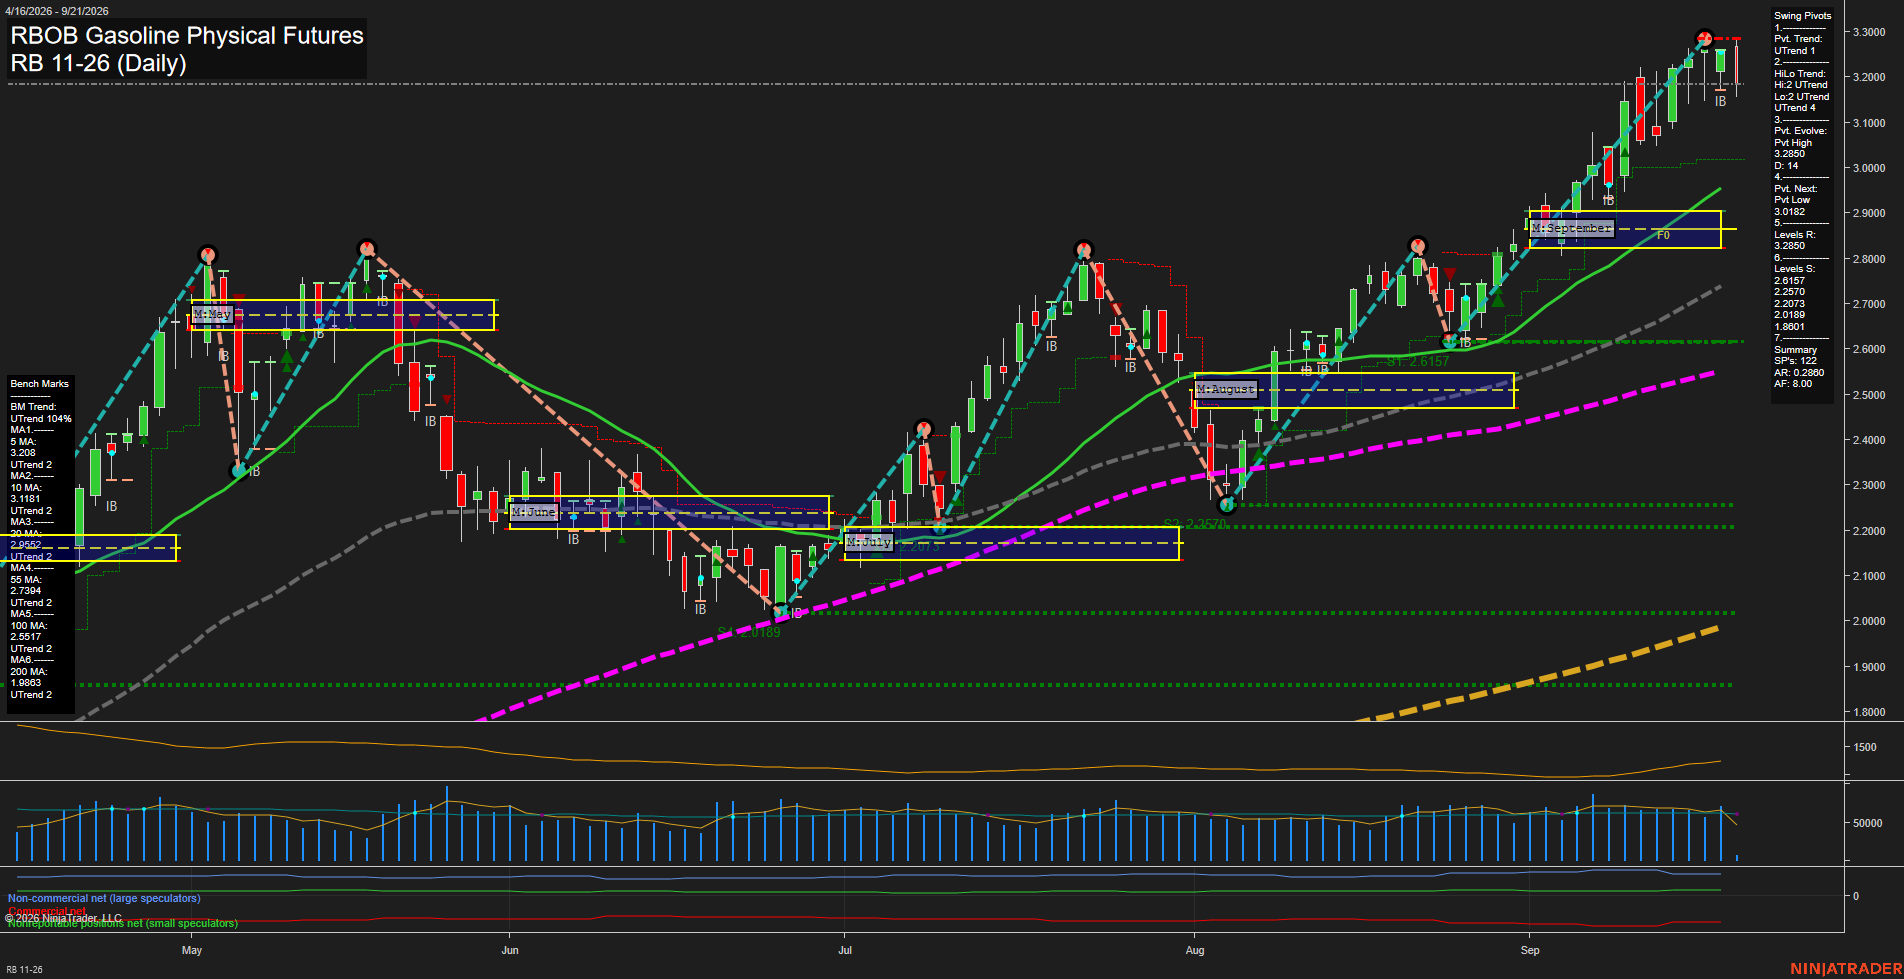
RB RBOB Gasoline Physical Futures Daily Chart Analysis: 2026-Sep-21 07:10 CT
Price Action
- Last: 3.1850,
- Bars: Large,
- Mom: fast.
WSFG Weekly
- Short-Term
- WSFG Current: -33%
- F0%/NTZ' Bias: Price Below,
- WSFG Trend: Down.
MSFG Month Sep
- Intermediate-Term
- MSFG Current: 65%
- F0%/NTZ' Bias: Price Above,
- MSFG Trend: Up.
YSFG Year 2026
- Long-Term
- YSFG Current: 230%
- F0%/NTZ' Bias: Price Above,
- YSFG Trend: Up.
Swing Pivots
- (Short-Term) 1. Pvt. Trend: UTrend,
- (Intermediate-Term) 2. HiLo Trend: UTrend,
- 3. Pvt. Evolve: Pvt high 3.2850,
- 4. Pvt. Next: Pvt low 3.0182,
- 5. Levels R: 3.2850,
- 6. Levels S: 2.6157, 2.2570, 2.2073, 2.0189, 1.8001.
Daily Benchmarks
- (Short-Term) 5 Day: 3.2090 Up Trend,
- (Short-Term) 10 Day: 3.1181 Up Trend,
- (Intermediate-Term) 20 Day: 2.9542 Up Trend,
- (Intermediate-Term) 55 Day: 2.7394 Up Trend,
- (Long-Term) 100 Day: 2.5517 Up Trend,
- (Long-Term) 200 Day: 1.9839 Up Trend.
Additional Metrics
Recent Trade Signals
- 17 Sep 2026: Short RB 10-26 @ 3.406 Signals
Chart Analysis ATS AI Generated: 2026-09-21 07:11 for Informational use only, not trading advice. Terms and Risk Disclosure Copyright © 2026. Algo Trading Systems LLC.