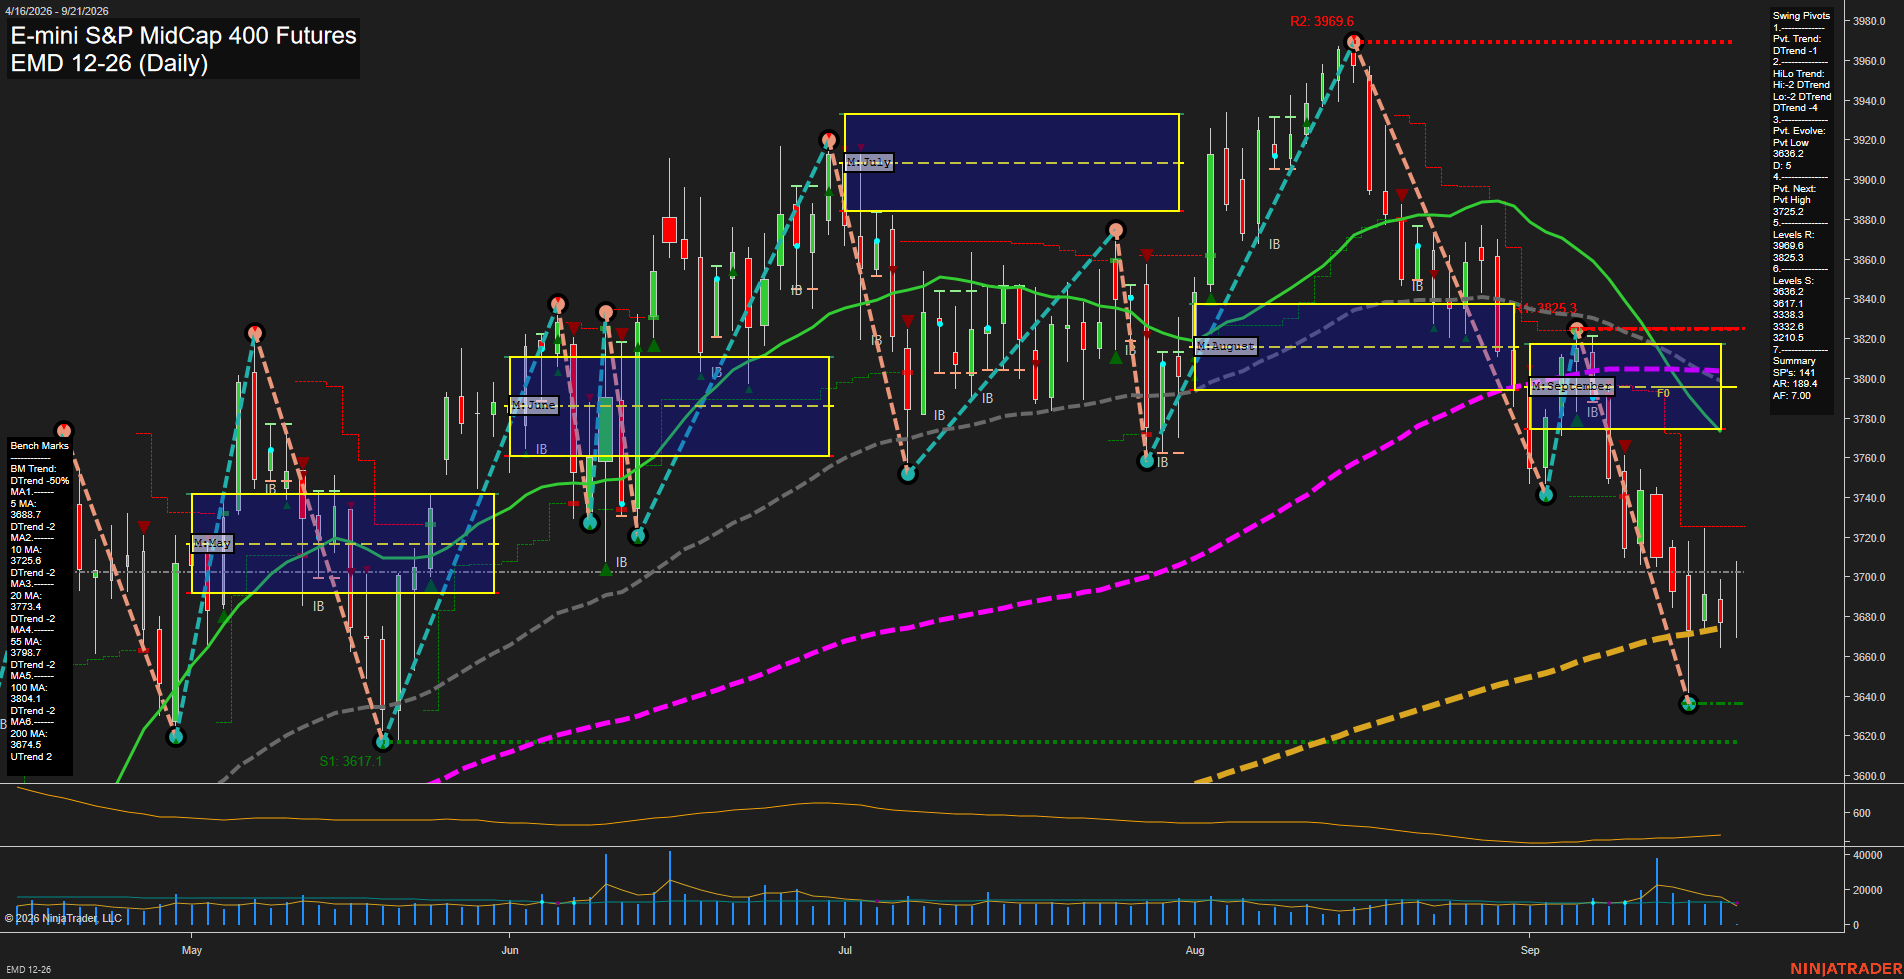
EMD E-mini S&P MidCap 400 Futures Daily Chart Analysis: 2026-Sep-21 07:04 CT
Price Action
- Last: 3678.0,
- Bars: Large,
- Mom: fast.
WSFG Weekly
- Short-Term
- WSFG Current: 35%
- F0%/NTZ' Bias: Price Above,
- WSFG Trend: Up.
MSFG Month Sep
- Intermediate-Term
- MSFG Current: -61%
- F0%/NTZ' Bias: Price Below,
- MSFG Trend: Down.
YSFG Year 2026
- Long-Term
- YSFG Current: 37%
- F0%/NTZ' Bias: Price Above,
- YSFG Trend: Up.
Swing Pivots
- (Short-Term) 1. Pvt. Trend: DTrend,
- (Intermediate-Term) 2. HiLo Trend: DTrend,
- 3. Pvt. Evolve: Pvt low 3636.2,
- 4. Pvt. Next: Pvt high 3725.2,
- 5. Levels R: 3969.6, 3825.3,
- 6. Levels S: 3636.2, 3617.1, 3333.6, 3320.5.
Daily Benchmarks
- (Short-Term) 5 Day: 3688.7 Down Trend,
- (Short-Term) 10 Day: 3725.6 Down Trend,
- (Intermediate-Term) 20 Day: 3773.2 Down Trend,
- (Intermediate-Term) 55 Day: 3798.7 Down Trend,
- (Long-Term) 100 Day: 3804.7 Down Trend,
- (Long-Term) 200 Day: 3674.5 Down Trend.
Additional Metrics
Overall Rating
- Short-Term: Bearish,
- Intermediate-Term: Bearish,
- Long-Term: Bearish.
Key Insights Summary
Price remains in a sharp daily downswing following rejection from the 3969.6 pivot high, with lower highs and lower lows confirmed by both short-term pivot and intermediate HiLo trends. The weekly grid remains above F0%, but this countertrend condition contrasts with negative monthly grid positioning, broad moving-average weakness, and downside trend signals. The decline has extended toward the 3636.2 pivot-low support area while the 200-day average near 3674.5 is being closely tested. Resistance is layered at 3725.2, 3773.2, 3798.7, and 3825.3, defining the overhead recovery zone within the current bearish structure.
Chart Analysis ATS AI Generated: 2026-09-21 07:04 for Informational use only, not trading advice. Terms and Risk Disclosure Copyright © 2026. Algo Trading Systems LLC.