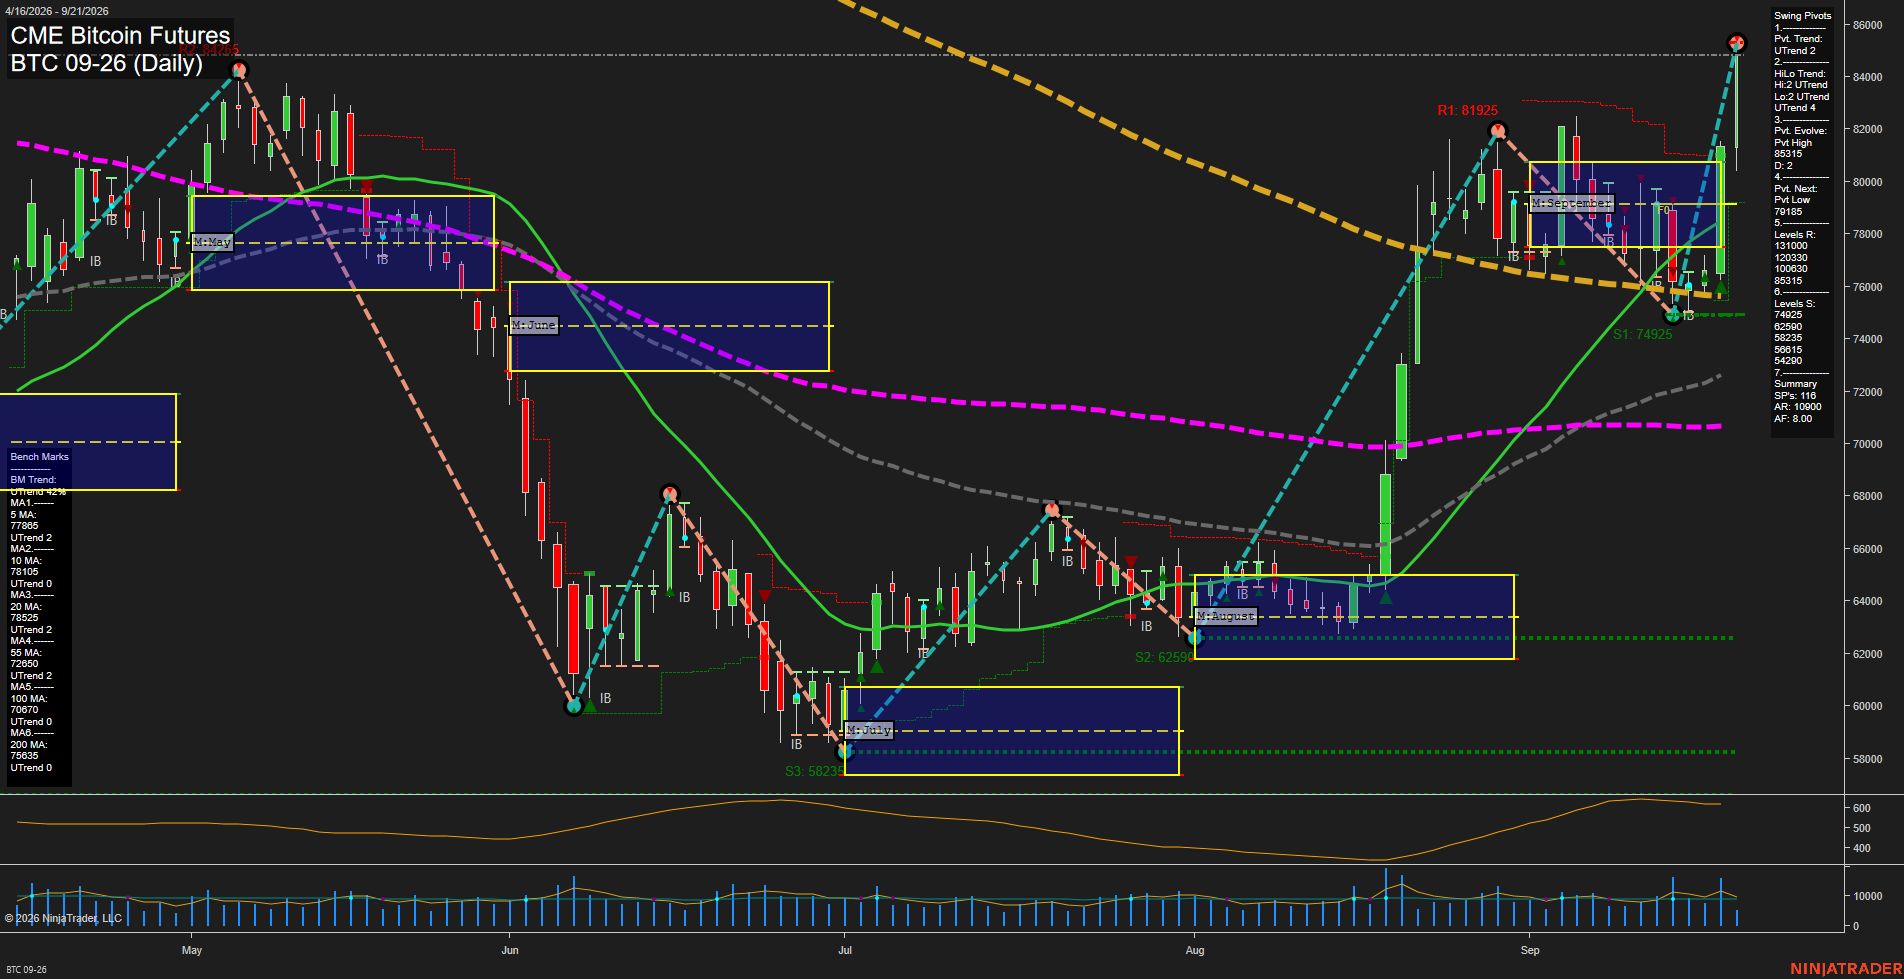
BTC CME Bitcoin Futures Daily Chart Analysis: 2026-Sep-21 07:02 CT
Price Action
- Last: 84265,
- Bars: Large,
- Mom: fast.
WSFG Weekly
- Short-Term
- WSFG Current: 96%
- F0%/NTZ' Bias: Price Above,
- WSFG Trend: Up.
MSFG Month Sep
- Intermediate-Term
- MSFG Current: 39%
- F0%/NTZ' Bias: Price Above,
- MSFG Trend: Up.
YSFG Year 2026
- Long-Term
- YSFG Current: -20%
- F0%/NTZ' Bias: Price Below,
- YSFG Trend: Down.
Swing Pivots
- (Short-Term) 1. Pvt. Trend: UTrend,
- (Intermediate-Term) 2. HiLo Trend: UTrend,
- 3. Pvt. Evolve: Pvt high 85265,
- 4. Pvt. Next: Pvt low 79185,
- 5. Levels R: 131000, 120330, 100630, 85265,
- 6. Levels S: 74990, 62590, 58235, 56815, 54290.
Daily Benchmarks
- (Short-Term) 5 Day: 77885 Up Trend,
- (Short-Term) 10 Day: 78100 Up Trend,
- (Intermediate-Term) 20 Day: 78525 Up Trend,
- (Intermediate-Term) 55 Day: 72650 Up Trend,
- (Long-Term) 100 Day: 70670 Up Trend,
- (Long-Term) 200 Day: 75635 Up Trend.
Additional Metrics
Recent Trade Signals
- 18 Sep 2026: Long BTC 09-26 @ 80890 Signals.USAR-MSFG
- 18 Sep 2026: Long BTC 09-26 @ 77620 Signals.USAR-WSFG
- 15 Sep 2026: Short BTC 09-26 @ 76975 Signals.USAR.TR120
Overall Rating
- Short-Term: Bullish,
- Intermediate-Term: Bullish,
- Long-Term: Bullish.
Key Insights Summary
Price has produced a powerful V-shaped recovery from the August base, advancing above every daily benchmark and re-establishing a higher-high, higher-low pivot structure. The large-range rally into 84265 reflects fast upside momentum and places price near the evolving 85265 pivot-high resistance. Weekly and monthly fib-grid readings remain positive, while the yearly grid remains below its F0% reference, showing that the current rally is a strong recovery within a still-rebuilding longer-cycle structure. The 74990 pivot support and clustered 5-to-20 day averages near 77885-78525 define the nearest underlying trend structure.
Chart Analysis ATS AI Generated: 2026-09-21 07:02 for Informational use only, not trading advice. Terms and Risk Disclosure Copyright © 2026. Algo Trading Systems LLC.