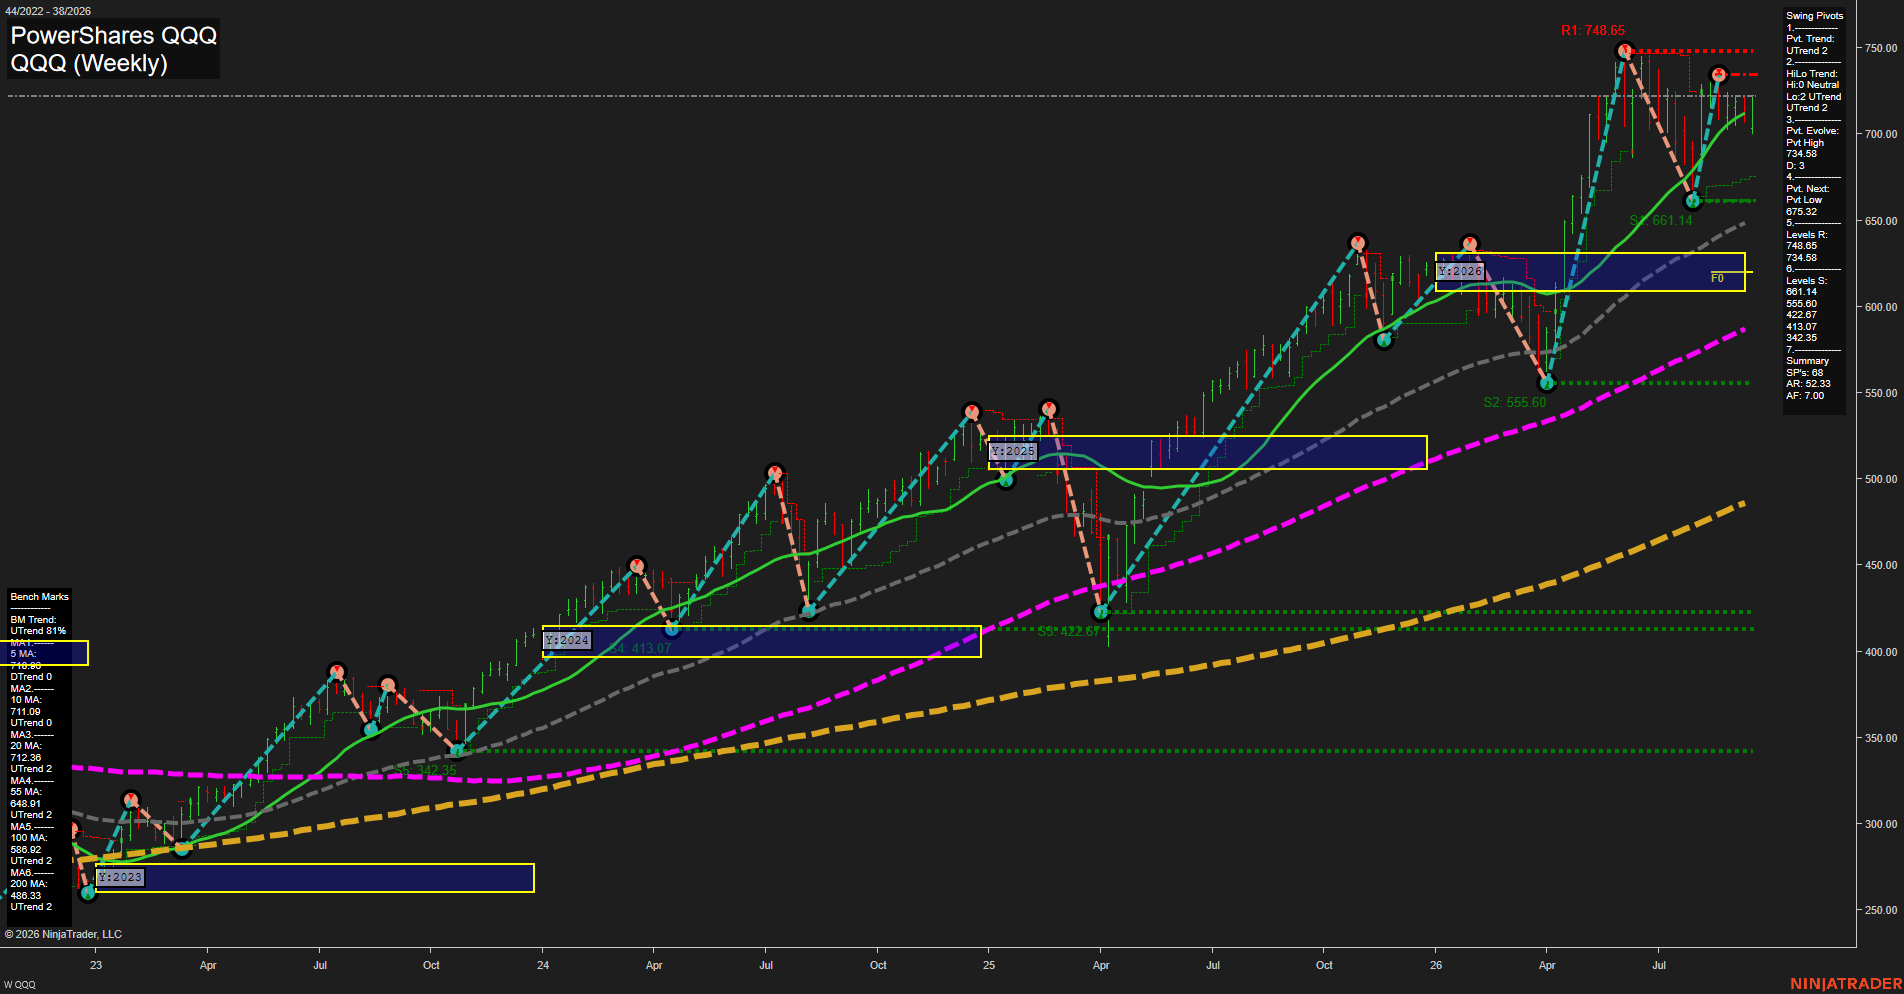
QQQ PowerShares QQQ Weekly Chart Analysis: 2026-Sep-20 18:07 CT
Price Action
- Last: 723.00,
- Bars: Small,
- Mom: Average.
WSFG Weekly
- Short-Term
- WSFG Current: NA%
- F0%/NTZ' Bias: Price Bullish,
- WSFG Trend: Bullish.
MSFG Month Sep
- Intermediate-Term
- MSFG Current: NA%
- F0%/NTZ' Bias: Price Bullish,
- MSFG Trend: Bullish.
YSFG Year 2026
- Long-Term
- YSFG Current: NA%
- F0%/NTZ' Bias: Price Bullish,
- YSFG Trend: Bullish.
Swing Pivots
- (Short-Term) 1. Pvt. Trend: UTrend,
- (Intermediate-Term) 2. HiLo Trend: UTrend,
- 3. Pvt. Evolve: Pvt high 734.58,
- 4. Pvt. Next: Pvt low 675.32,
- 5. Levels R: 775.33, 734.58,
- 6. Levels S: 661.14, 555.60, 522.67, 413.07, 342.35.
Weekly Benchmarks
- (Short-Term) 5 Day: 714.93 Up Trend,
- (Short-Term) 10 Day: 711.09 Up Trend,
- (Intermediate-Term) 20 Day: 712.38 Up Trend,
- (Intermediate-Term) 55 Day: 648.91 Up Trend,
- (Long-Term) 100 Day: 586.92 Up Trend,
- (Long-Term) 200 Day: 486.33 Up Trend.
Overall Rating
- Short-Term: Bullish,
- Intermediate-Term: Bullish,
- Long-Term: Bullish.
Key Insights Summary
QQQ remains in a broad weekly higher-high and higher-low structure, a condition that aligns with a constructive Nasdaq futures swing backdrop. Price is holding above the rising 5-, 10-, 20-, 55-, 100-, and 200-period benchmarks, with the wide separation above the 55-period average confirming a strong intermediate and long-term advance. The recent recovery from the 661.14 pivot low produced a V-shaped continuation back toward 734.58 resistance; the current small weekly bars reflect consolidation beneath that prior swing high rather than a decisive trend failure. A weekly resolution above 734.58 would restore focus toward 775.33, while 675.32 and 661.14 define the nearer swing-structure support zone. The yearly Fib grid is below current price, reinforcing that the dominant 2026 auction remains above its annual neutral zone despite elevated price extension.
Chart Analysis ATS AI Generated: 2026-09-20 18:08 for Informational use only, not trading advice. Terms and Risk Disclosure Copyright © 2026. Algo Trading Systems LLC.