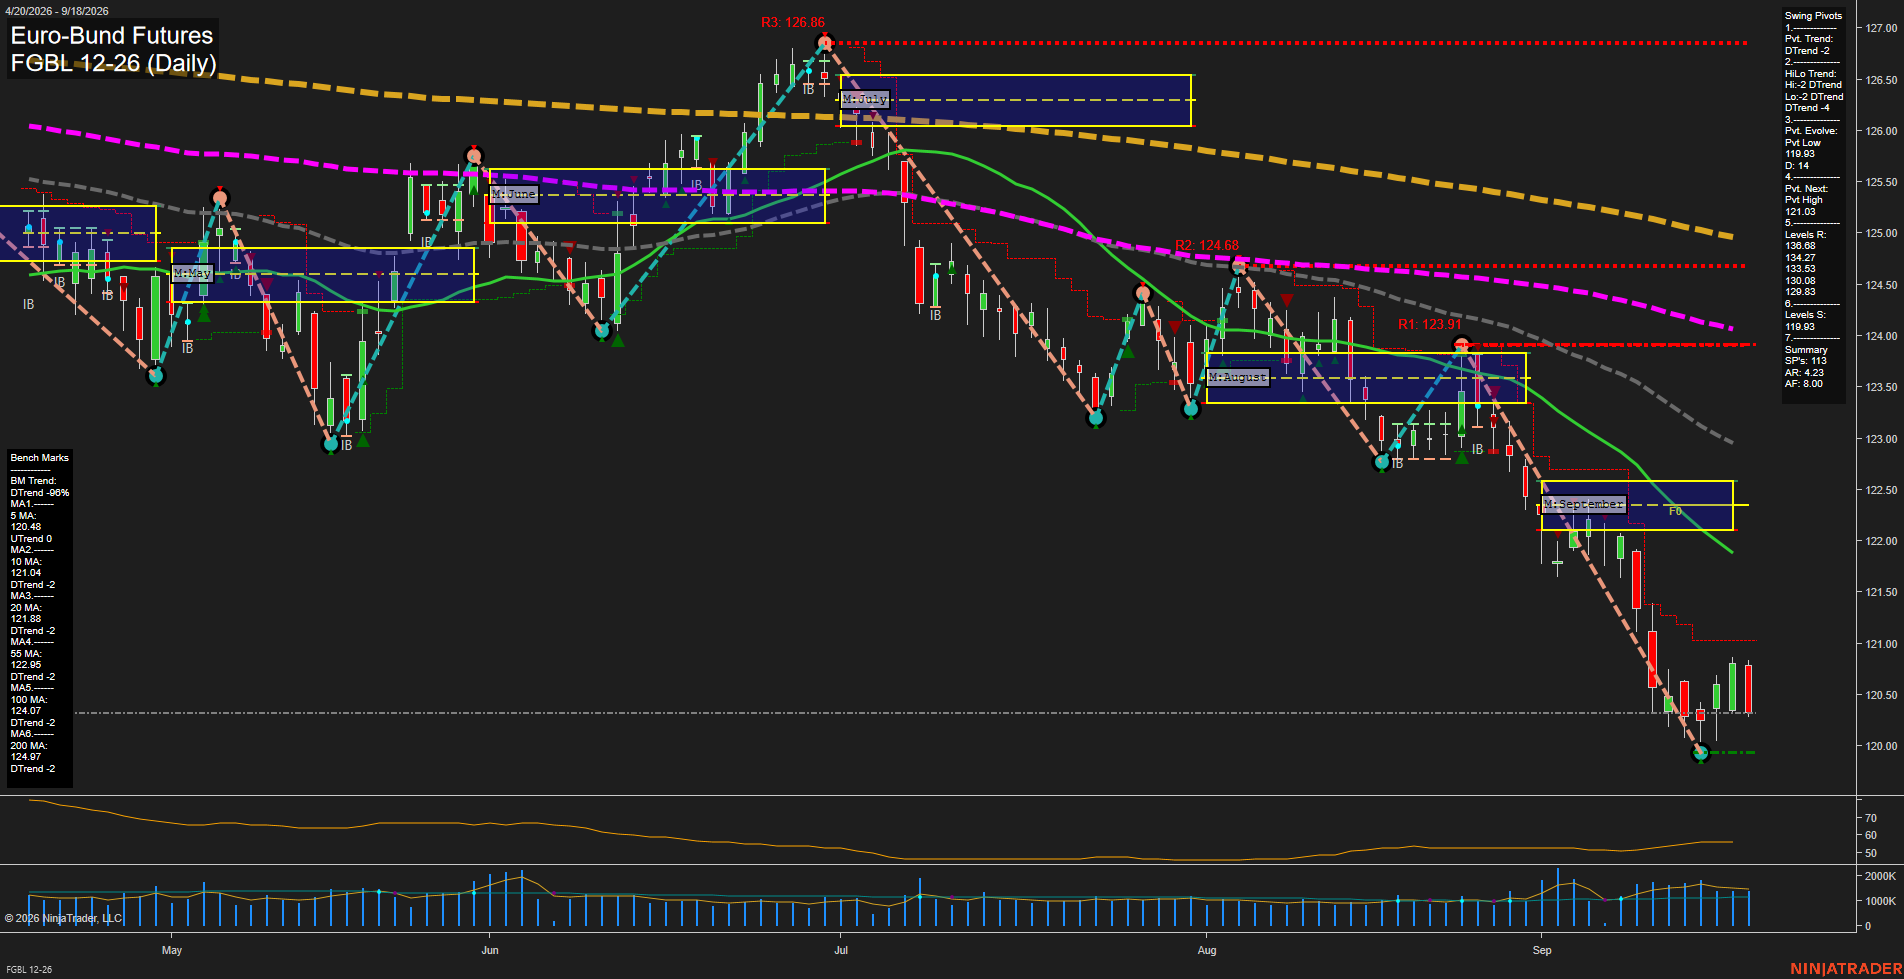
FGBL Euro-Bund Futures Daily Chart Analysis: 2026-Sep-20 18:05 CT
Price Action
- Last: 120.48,
- Bars: Small,
- Mom: Fast.
WSFG Weekly
- Short-Term
- WSFG Current: -12%
- F0%/NTZ' Bias: Price Below,
- WSFG Trend: Down.
MSFG Month Sep
- Intermediate-Term
- MSFG Current: -65%
- F0%/NTZ' Bias: Price Below,
- MSFG Trend: Down.
YSFG Year 2026
- Long-Term
- YSFG Current: -44%
- F0%/NTZ' Bias: Price Below,
- YSFG Trend: Down.
Swing Pivots
- (Short-Term) 1. Pvt. Trend: DTrend,
- (Intermediate-Term) 2. HiLo Trend: DTrend,
- 3. Pvt. Evolve: Pvt low 119.93,
- 4. Pvt. Next: Pvt high 121.08,
- 5. Levels R: 136.68, 134.27, 133.53, 130.08, 129.83,
- 6. Levels S: 119.93.
Daily Benchmarks
- (Short-Term) 5 Day: 120.48 Up Trend,
- (Short-Term) 10 Day: 121.04 Down Trend,
- (Intermediate-Term) 20 Day: 121.88 Down Trend,
- (Intermediate-Term) 55 Day: 122.15 Down Trend,
- (Long-Term) 100 Day: 124.07 Down Trend,
- (Long-Term) 200 Day: 124.97 Down Trend.
Additional Metrics
Recent Trade Signals
- 18 Sep 2026: Short FGBL 12-26 @ 120.4 Signals.USAR-WSFG
- 17 Sep 2026: Long FGBL 12-26 @ 120.83 Signals.USAR.TR120
Overall Rating
- Short-Term: Bearish,
- Intermediate-Term: Bearish,
- Long-Term: Bearish.
Key Insights Summary
Euro-Bund futures remain in a broad, persistent decline, with price below every major benchmark except the rising 5-day average. The short-term structure shows a developing low pivot at 119.93 after a fast selloff, while small daily bars near 120.48 reflect consolidation close to the recent low. Weekly, monthly, and yearly Fib-grid readings remain below their F0%/NTZ areas, confirming aligned downside pressure across time frames. The 121.04 to 122.15 benchmark area and the next pivot trigger near 121.08 define the nearest overhead recovery zone, while 119.93 remains the active swing-low reference.
Chart Analysis ATS AI Generated: 2026-09-20 18:05 for Informational use only, not trading advice. Terms and Risk Disclosure Copyright © 2026. Algo Trading Systems LLC.